Study Finds Ants May Help Suppress Coffee Berry Borer
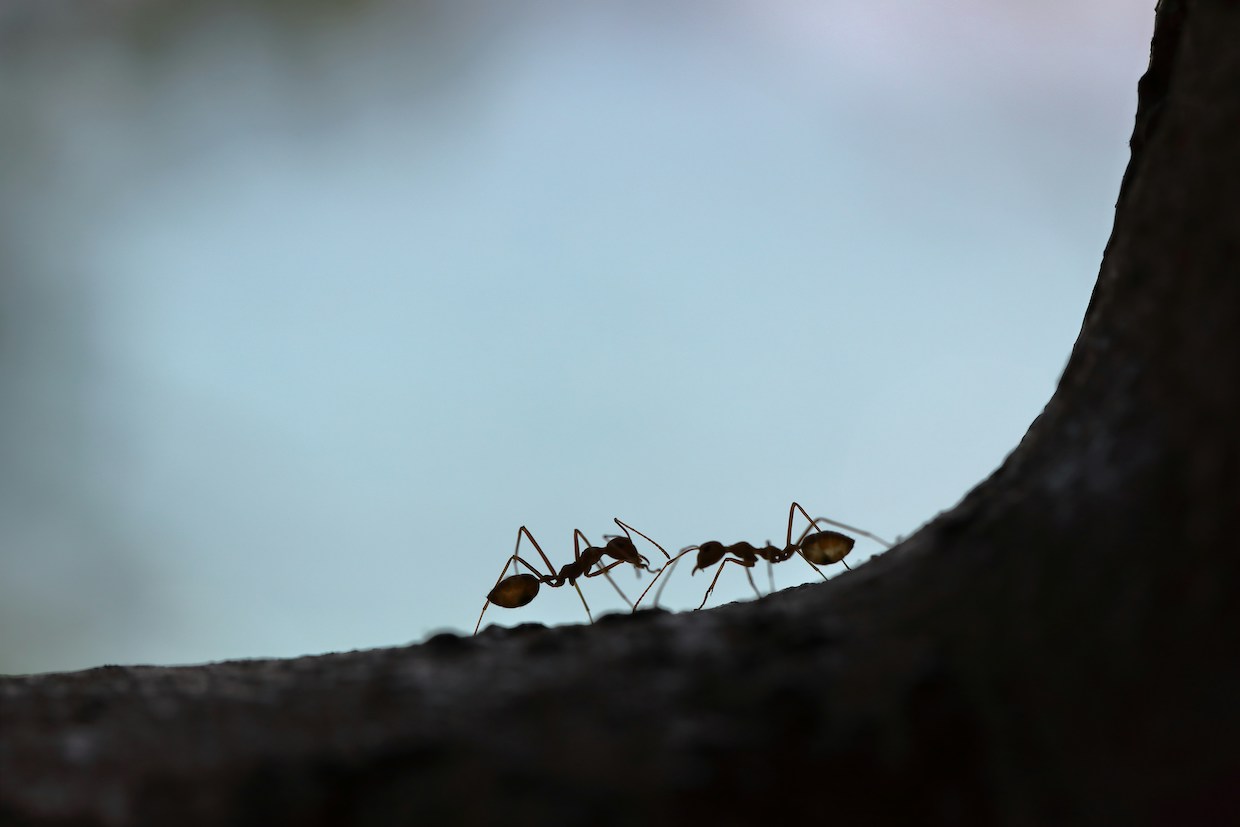
- Small ants evict coffee berry borers from coffee fruits and use their cavities for reproduction.
- This reproductive benefit may support more diverse ant communities on coffee plants.
- Large ants eat the borers, while small ants root them out of their homes in coffee berries.
- The discovery was made by Jonathan Morris during graduate research in Chiapas, Mexico.
- The study highlights the importance of observational science in ecological discovery.
- Findings published in The Scientific Naturalist section of the journal Ecology.
- Research conducted at a farm station established by University of Michigan ecologists.
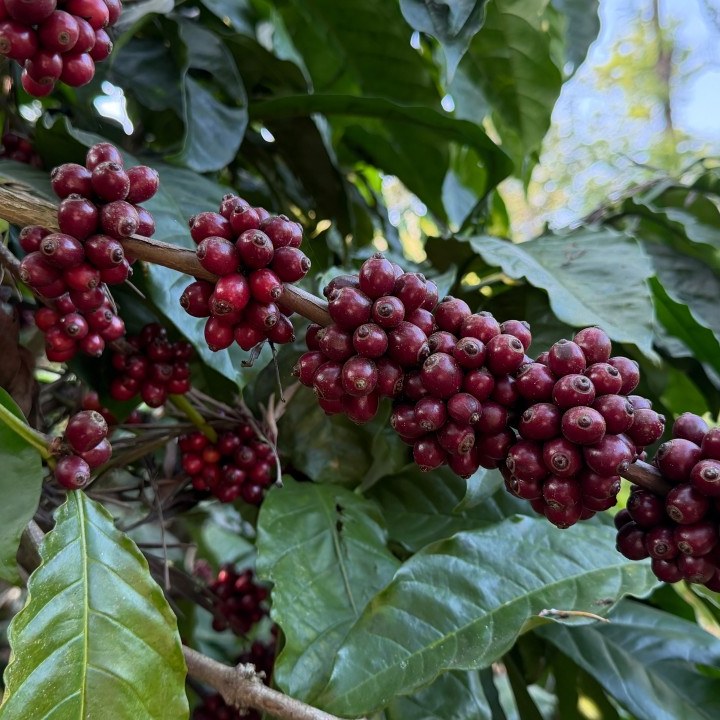
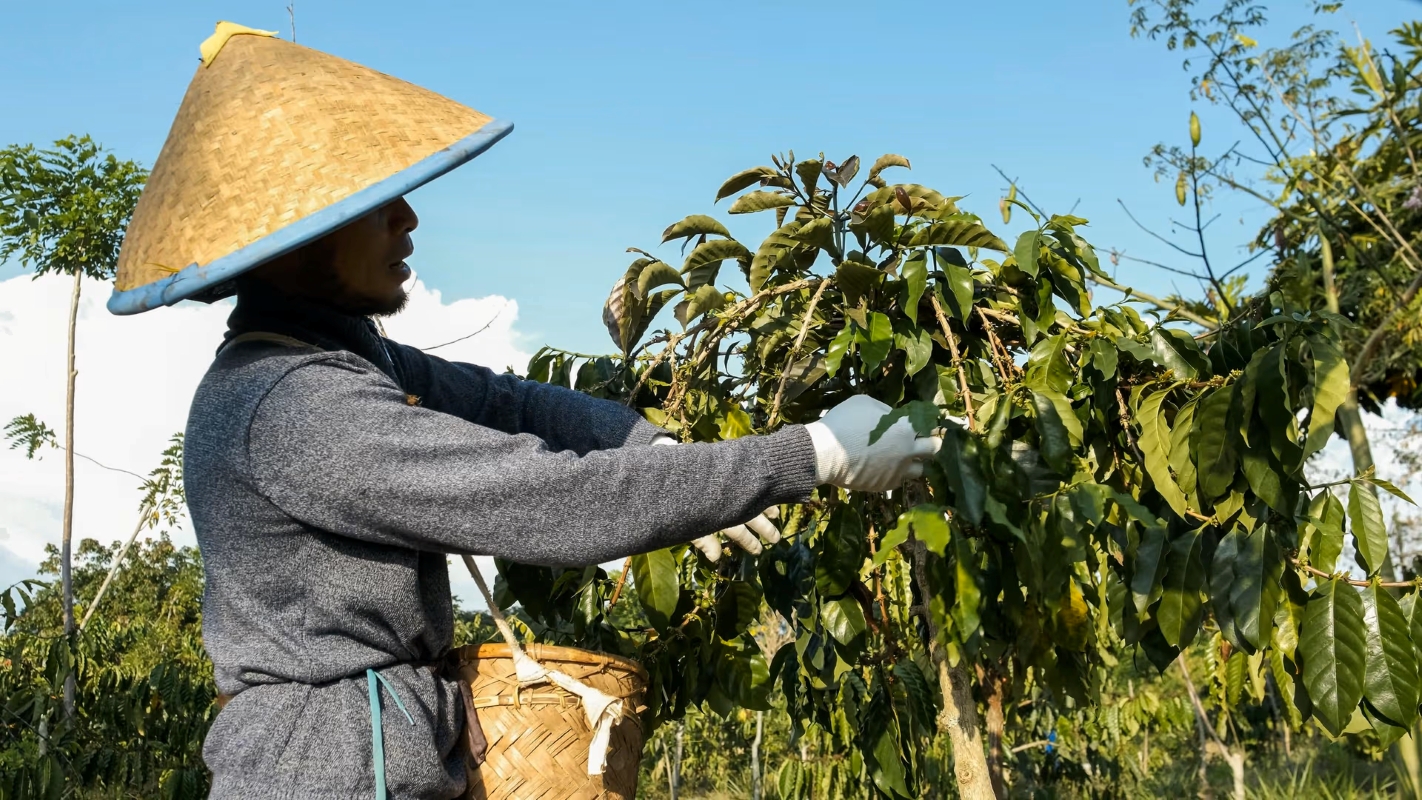
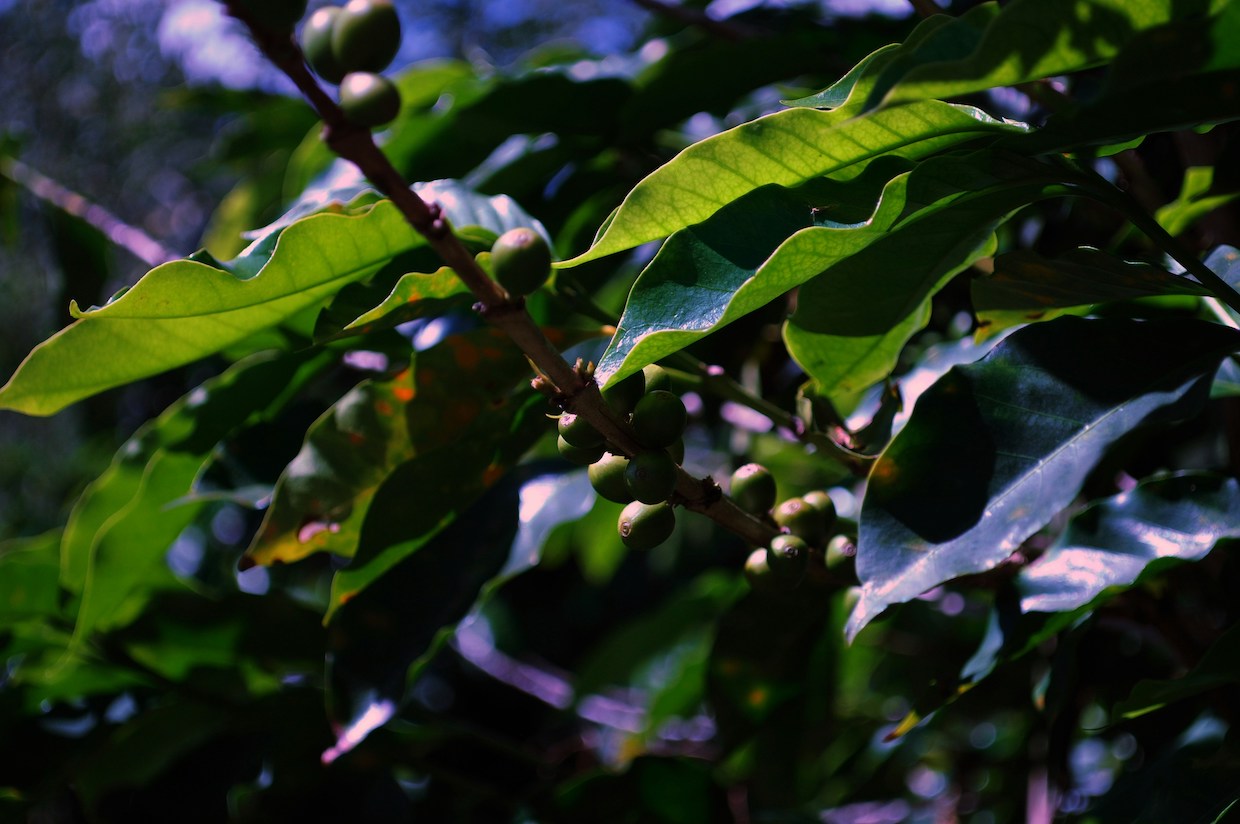
Ants are known allies in the fight against coffee berry borers. These pests cause significant damage to coffee crops worldwide. However, a new discovery reveals a previously unknown dimension of this natural pest control.
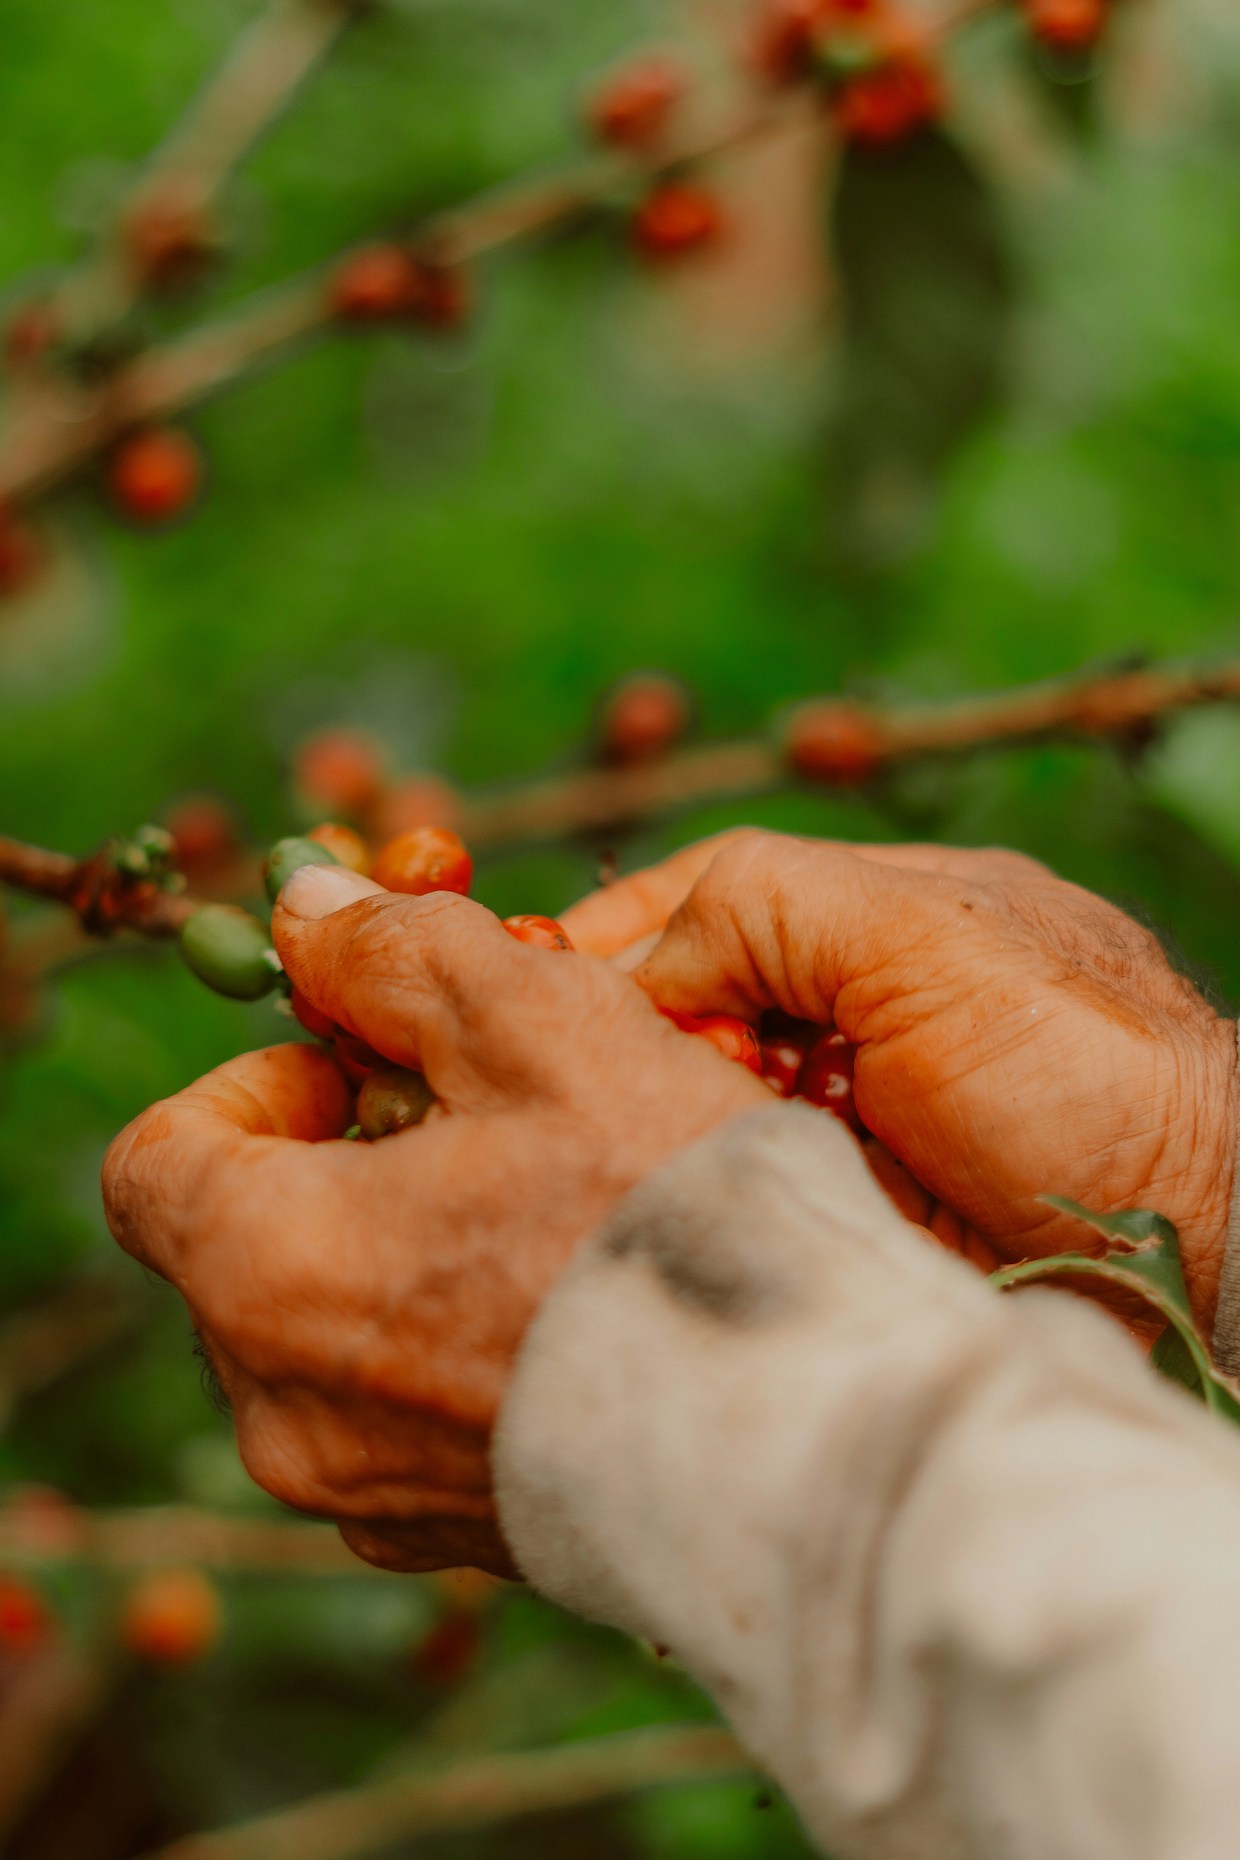
Jonathan Morris, a postdoctoral researcher at the National Autonomous University of Mexico, made the discovery while studying coffee plants in Chiapas, Mexico. He observed that small ants evict borers from coffee fruits and then use the borer-made cavities to rear their own young.
A New Dimension of Pest Control
Ecologists have long known that large ants eat coffee berry borers. They also know that these ants stymie the pests’ efforts to colonize coffee plants. Small ants can root the borers out of their homes in the coffee fruits. However, what happens next was unknown until now.
Morris discovered that small ant species then use the habitats in the fruits for their own reproduction. This is the first documented evidence of ants taking advantage of the niche construction created by the berry borer.
“In terms of pest control, this is primarily a good thing because it’s benefiting the ants in terms of their populations and fitness. The ants gain this reproductive benefit that’s originally created by the coffee pest. And this might actually help to maintain more diverse ant communities directly on the coffee plants.”
— Jonathan R. Morris, Postdoctoral Researcher, UNAM
From Field Samples to Evidence
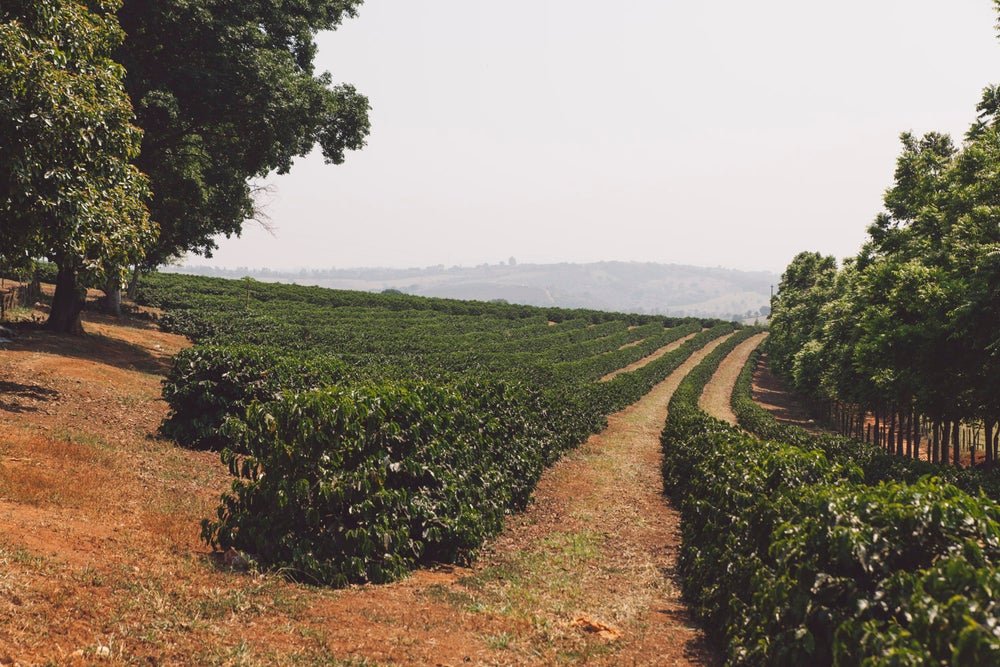
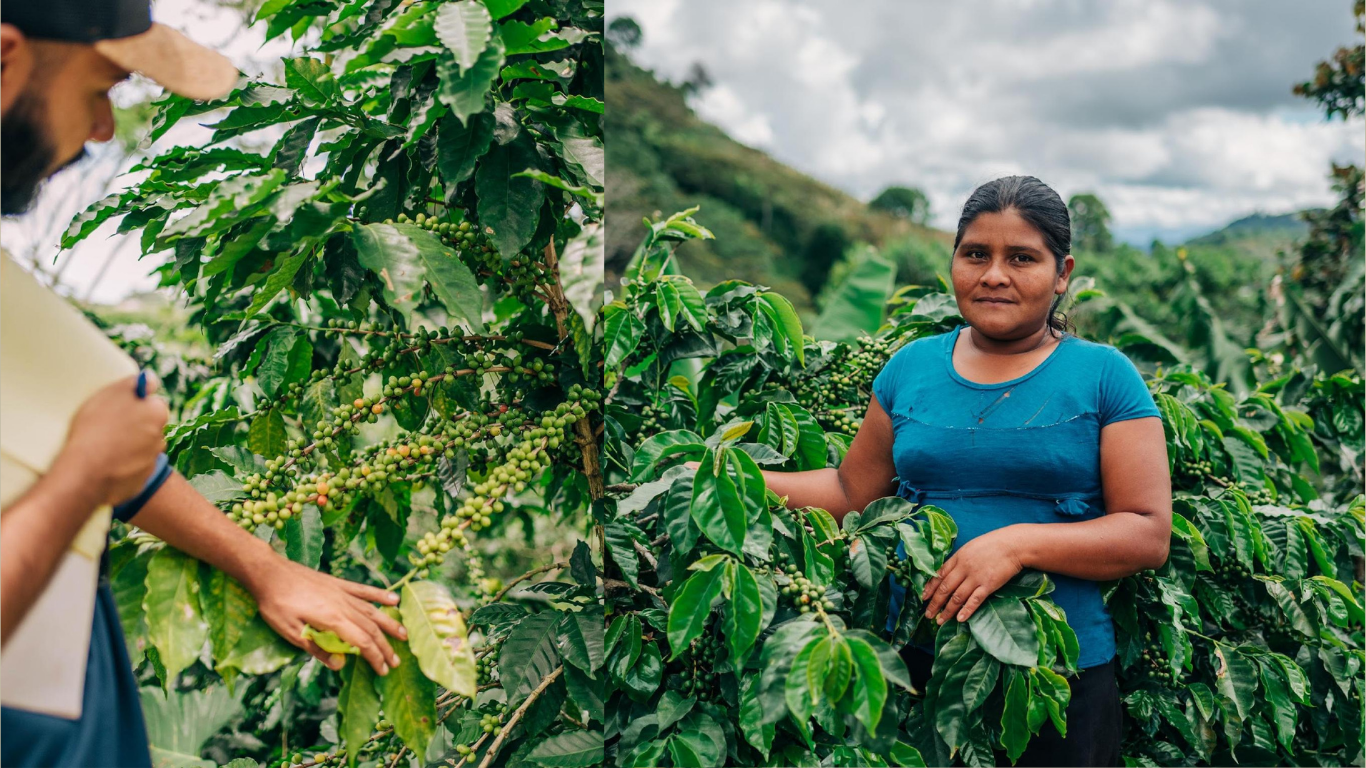
Morris started this project in 2016. At the time, he was working at a research station in Chiapas, Mexico. The station was established by professors Ivette Perfecto and John Vandermeer from the University of Michigan. Perfecto has been studying agricultural ecosystems on coffee farms in Central America for 25 years.
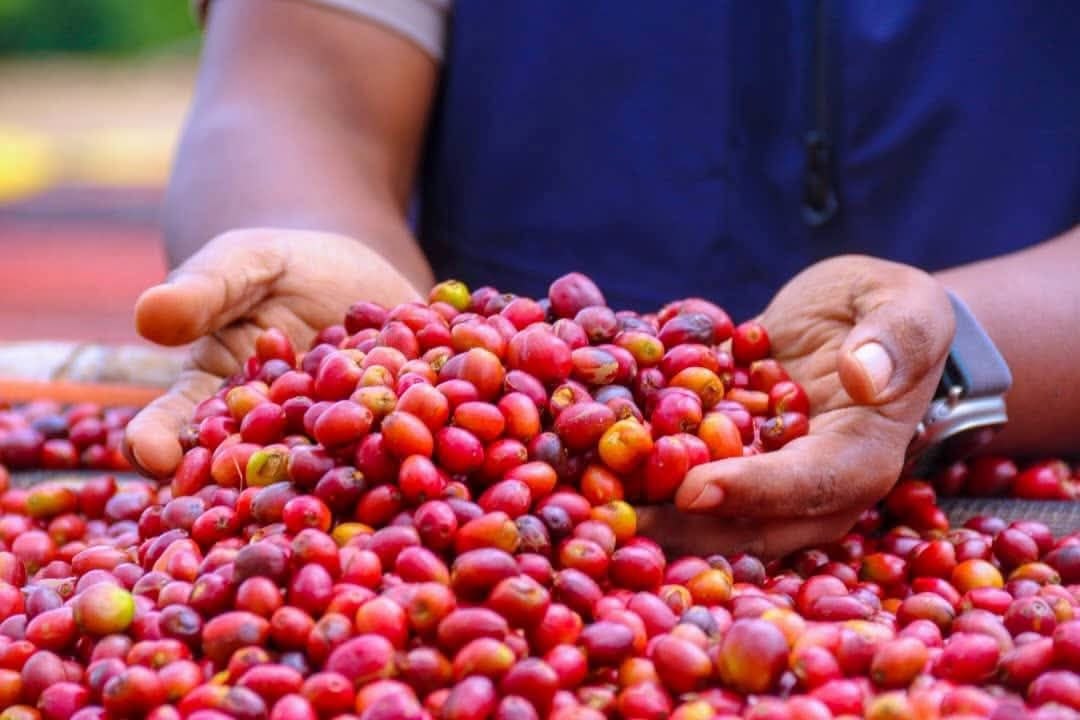
While conducting research for a different project, Morris collected samples of coffee berries. These berries had been infiltrated by borers and then evicted by ants. He kept the ants in vials and thought about studying them later. Years later, he realized that this behavior had never been documented before.
“I had all these ants in vials that I had found nesting in coffee fruits and told myself, ‘Maybe I’ll do something with this at some point,'” Morris said. “Then, years later, I got to thinking about it and, as far as I know, this is the first time anyone’s documented or reported the ants taking advantage of the niche construction by the berry borer and using it to reproduce themselves.”
| Element | Details |
|---|---|
| Lead Researcher | Jonathan R. Morris (UNAM, formerly U-M) |
| Study Location | Chiapas, Mexico |
| Research Started | 2016 |
| Photographic Evidence | 2025 |
| Publication | Ecology journal (The Scientific Naturalist section) |
| Key Finding | Small ants use borer-made cavities for reproduction |
| Broader Impact | May support diverse ant communities on coffee plants |
Observation Still Drives Discovery
The study has implications beyond ecology and pest control. It also underscores the importance of being in nature and observing what it is doing. This is especially relevant in the age of data science and artificial intelligence.
Morris noted that funders currently emphasize AI and big data. However, before these tools existed, scientists made discoveries by going out into nature and observing. He cited Charles Darwin and Alexander von Humboldt as examples of this tradition.
“But if it wasn’t for having funding for basic science and doing these types of observations, I wouldn’t be sitting here talking about them,” Morris said.
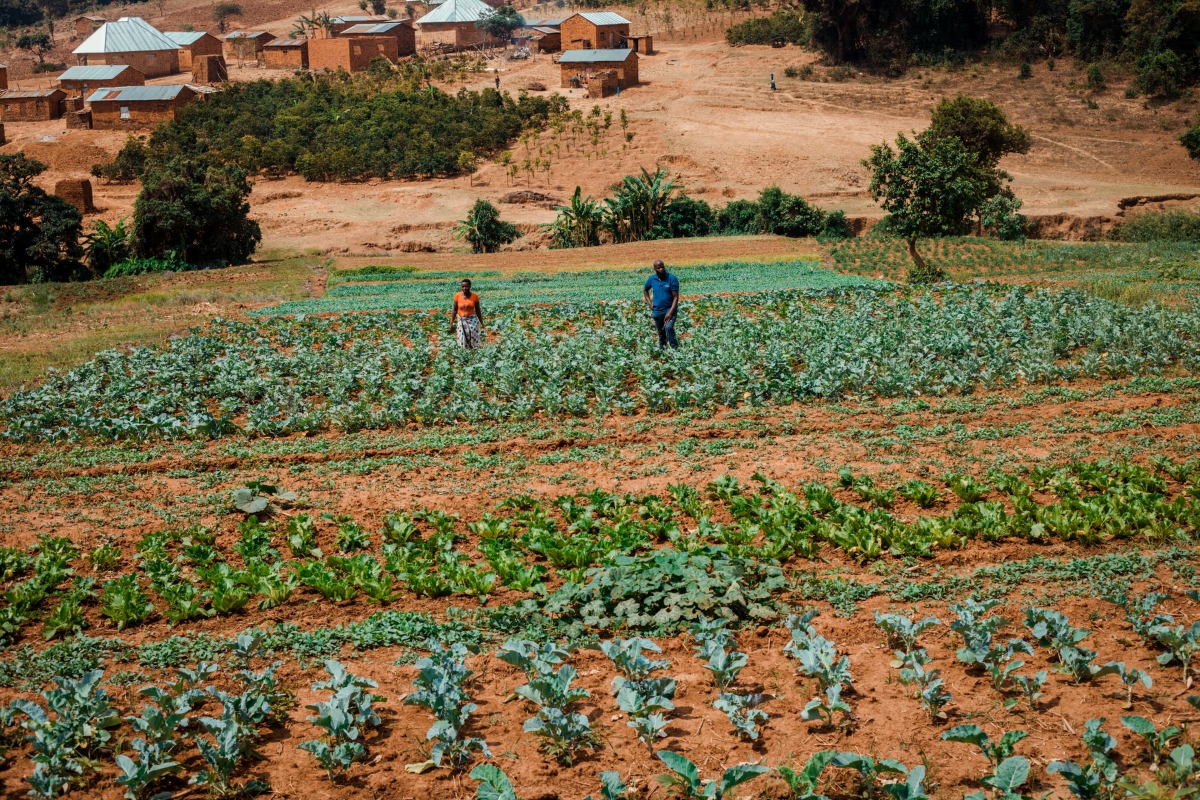
Implications for Coffee Farming
The discovery has significant implications for coffee farming. Coffee berry borers are among the most destructive pests affecting coffee crops. They cause millions of dollars in damage annually.
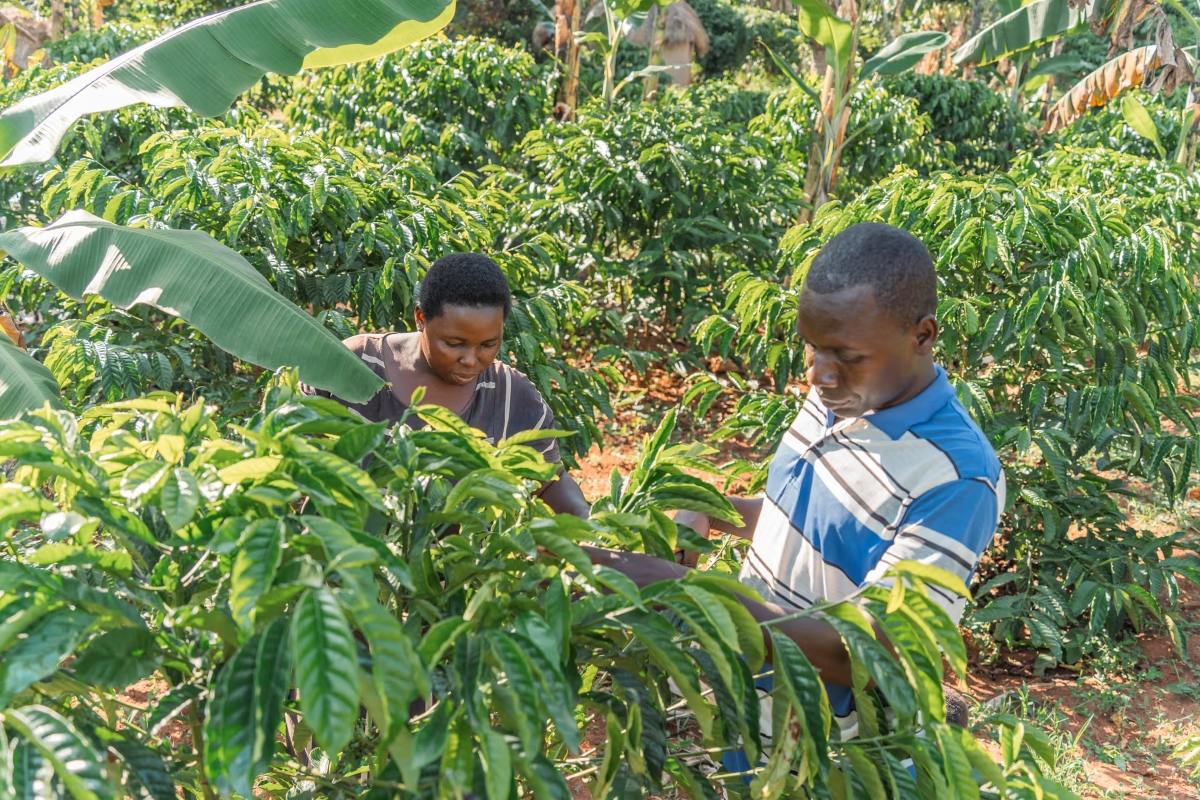
Ants are already valued as natural allies in pest control. This new evidence suggests their role may be even more important than previously understood. Encouraging diverse ant communities on coffee farms could enhance natural pest suppression and reduce reliance on chemical pesticides.
Frequently Asked Questions
What did the study discover about ants and coffee berry borers?Small ants evict coffee berry borers from coffee fruits and then use the borer-made cavities to rear their own young.
Why is this discovery important?It shows that ants gain a reproductive benefit from the pests, which may support more diverse and stable ant communities on coffee plants.
Where was the research conducted?The research was conducted in Chiapas, Mexico, at a research station established by University of Michigan ecologists.
Who led the study?Jonathan R. Morris, now a postdoctoral researcher at UNAM, led the study while he was a graduate student at the University of Michigan.
How does this help coffee farmers?It highlights the importance of maintaining diverse ant communities on coffee farms to enhance natural pest control and reduce pesticide use.
Where were the findings published?The findings were published in The Scientific Naturalist section of the journal Ecology.