USDA Report: Record World Coffee Production in 2026/27

Source: USDA Foreign Agricultural Service (FAS) – Coffee: World Markets and Trade
Author: Qahwa World
Date: July 23, 2026This article covers important findings from the world coffee market report 2026.

USDA Report: Record World Coffee Production in 2026/27

  • World coffee production forecast at a record 189.7 million bags in 2026/27, up 10.8 million from the previous year.
  • Brazil leads the surge with a record 71.9 million bags, driven by a 9.5 million bag Arabica rebound.
  • Global consumption rises to a record 179.7 million bags, with the European Union and United States leading gains.
  • World bean exports forecast at a record 131.4 million bags, up 11.9 million from 2025/26.
  • Ending stocks rise for a second consecutive year to 26.3 million bags.
  • Coffee prices have fallen 25% over the last seven months as additional supplies become available.
  • Vietnam, Colombia, Ethiopia, and Uganda all post production increases, while Indonesia declines.

The USDA Foreign Agricultural Service released its latest Coffee: World Markets and Trade report. Global coffee production for 2026/27 is forecast at a record 189.7 million bags. This represents an increase of 10.8 million bags from the previous year.

Record output in Brazil, Ethiopia, Uganda, and Vietnam drives this growth. These gains more than compensate for losses in India and Indonesia. World coffee bean exports are expected to reach a record 131.4 million bags. Global consumption is forecast to rise to a record 179.7 million bags.

World Production at Record High

World coffee production for 2026/27 is forecast 10.8 million bags higher than the previous year. Production is expected to reach a record 189.7 million bags. Brazil accounts for the largest share with a record 71.9 million bags. The rebound in Arabica production is particularly notable after five years of underperformance.

World Coffee Production 2026/27 (Million 60-kg Bags)
Category 2025/26 2026/27 Forecast Change
Total Production 178.8 189.7 +10.8
Arabica Production 94.4 105.9 +11.4
Robusta Production 84.4 83.8 -0.6

Brazil: Record Production and Arabica Rebound

Brazil’s combined Arabica and Robusta harvest is forecast at a record 71.9 million bags in 2026/27. This represents an increase of 8.9 million bags from the previous year. Arabica output is expected to rebound 9.5 million bags to 47.5 million, ending a five-year period of underperformance due to adverse weather conditions.

Timely rainfall during flowering in September and October ensured favorable fruit development. Near-record yields were achieved in Minas Gerais, where over 70% of Arabica coffee is grown. Robusta production is forecast to retreat 600,000 bags to 24.4 million following last year’s record harvest. Cooler temperatures combined with elevated rainfall lowered yields in Espirito Santo, where approximately 70% of Robusta is grown.

Brazil accounts for nearly 40% of world production and exerts significant influence on global supplies and prices. Brazil’s role in Arabica markets is even more pronounced, typically supplying between 40% and 50% depending on the biennial crop production cycle.

Brazil Coffee Production Outlook 2026/27
Category 2025/26 2026/27 Forecast Change
Arabica Production 38.0 million bags 47.5 million bags +9.5 million
Robusta Production 25.0 million bags 24.4 million bags -0.6 million
Total Production 63.0 million bags 71.9 million bags +8.9 million
Bean Exports 34.0 million bags 45.0 million bags +11.0 million
Ending Stocks 3.9 million bags 4.4 million bags +0.5 million

Global Consumption and Trade

World coffee bean exports are forecast 11.9 million bags higher to a record 131.4 million bags. This is driven by higher output in major producing countries. Global consumption is expected to rise to a record 179.7 million bags. The largest gains are occurring in the European Union and the United States.

Ending stocks are expected to rise for a second consecutive year to 26.3 million bags. This follows a significant drawdown between 2020/21 and 2024/25, when global ending stocks fell 15.5 million bags. While stocks are recovering, they remain below the long-term average.

World Coffee Summary 2026/27 (Million 60-kg Bags)
Category 2025/26 2026/27 Forecast Change
World Production 178.8 189.7 +10.8
World Bean Exports 119.5 131.4 +11.9
World Consumption 173.5 179.7 +6.3
Ending Stocks 24.4 26.3 +1.9

Country-by-Country Production Highlights

Vietnam production is forecast to increase 800,000 bags to a record 32.5 million. Expanding area and higher yields drive this growth. Recent high prices allowed growers to increase expenditures on fertilizers. Bean exports are forecast up 300,000 bags to 25.4 million. Domestic consumption is expected to reach a record 5.0 million bags.

Colombia output is expected to rise 900,000 bags to 13.4 million. Adequate soil moisture from last year’s excessive rains supports this growth. Increased utilization of fertilizers and pesticides also contributes. Bean exports, mostly to the United States and European Union, are forecast up 500,000 bags to 12.2 million.

Ethiopia is forecast to increase output by more than 500,000 bags to a record 12.1 million. Higher area and yield drive this growth. Over the last four years, growth has been driven by replacement of over half of the cultivated area with higher-yielding varieties. Bean exports are forecast up nearly 200,000 bags to 7.1 million.

Central America and Mexico production is forecast to rise nearly 600,000 bags to 17.7 million. Rebounding output in Costa Rica, Guatemala, Honduras, Mexico, and Panama contribute to this growth. Honduras is expected to account for nearly all the region’s growth, rebounding 500,000 bags to 6.0 million.

Indonesia production is forecast to drop 1.0 million bags to 11.4 million. Robusta output is expected to decrease 1.0 million bags to 10.0 million due to lower yields. Excessive rainfall disrupted flowering and cherry formation in Southern Sumatra and Java. Reduced output is expected to cut bean exports by over 800,000 bags to 7.0 million.

Key Country Production 2026/27 (Million 60-kg Bags)
Country 2025/26 2026/27 Forecast Change
Brazil 63.0 71.9 +8.9
Vietnam 31.7 32.5 +0.8
Colombia 12.5 13.4 +0.9
Ethiopia 11.6 12.1 +0.5
Indonesia 12.4 11.4 -1.0
Honduras 5.5 6.0 +0.5
Uganda 7.1 7.2 +0.1

Price Impact of Rising Supplies

Coffee prices have dropped 25% over the last seven months as additional supplies became available. This is measured by the International Coffee Organization monthly composite price index. The improving supply situation reflects record production and rising ending stocks.

However, ending stocks remain below the long-term average. Weather developments in key producing regions, particularly Minas Gerais in Brazil, remain the primary indicator for world market conditions. The biennial production cycle in Brazil continues to shape global supply and price expectations.

Revisions to 2025/26 Estimates

World production is unchanged from the December 2025 estimate of 178.8 million bags. Vietnam is raised 900,000 bags to 31.7 million on higher yields. Peru is up nearly 600,000 bags to 4.8 million. Colombia is lowered 1.3 million bags to 12.5 million due to excessive rain and cloud cover. Guatemala is reduced nearly 400,000 bags to 3.2 million due to coffee cherry borer and coffee rust.

World bean exports are revised down 4.3 million bags to 119.5 million. Brazil is lowered 3.0 million bags to 34.0 million due to lower shipments to the EU and United States. Ethiopia is reduced over 800,000 bags to 6.9 million on higher-than-anticipated domestic consumption. Vietnam is up 500,000 bags to 25.1 million on higher output.

Key Takeaways for the Coffee Industry

Record global production is expected to boost supplies significantly. Brazil’s Arabica rebound after five years of underperformance is particularly notable. This could help replenish global inventories that were drawn down in previous years.

Ending stocks are forecast to rise for a second consecutive year. However, they remain below the long-term average. Weather developments in Minas Gerais remain the primary indicator for world market conditions. Coffee prices have fallen 25% in seven months, reflecting improved supply. Producers and traders should monitor Brazil’s production cycle closely, as it heavily influences global market conditions.

Frequently Asked Questions

What is the forecast for global coffee production in 2026/27?World production is forecast at a record 189.7 million bags, up 10.8 million from the previous year.

What is Brazil’s production forecast?Brazil is forecast at a record 71.9 million bags, driven by a 9.5 million bag Arabica rebound.

What is the global consumption forecast?Global consumption is expected to rise to a record 179.7 million bags, with the largest gains in the EU and US.

What are ending stocks expected to be?Ending stocks are expected to rise for a second consecutive year to 26.3 million bags.

How have coffee prices responded to increased supply?Coffee prices have dropped 25% over the last seven months as additional supplies became available.

Which countries are driving production growth?Brazil, Vietnam, Colombia, Ethiopia, and Uganda are all posting production increases, while Indonesia declines.

ICO Coffee Market Report June 2026: Prices Rebound on El Niño Fears

Author: Qahwa World – London
Source: International Coffee Organization (ICO) – Coffee Market Report, June 2026
Date: July 2026

ICO Coffee Market Report June 2026: Prices Rebound on El Niño Fears

Executive Summary

  • The ICO Composite Indicator Price (I‑CIP) averaged 248.90 US cents/lb in June 2026, down 2.8% from May. However, prices rebounded sharply by 17.4% from a two-year low on June 9 to a two-month high at month-end.
  • Super El Niño fears (67% confidence) and excessive rainfall in Brazil (1,956% above average in Minas Gerais) slowed the harvest and raised quality concerns, reversing the downward trend.
  • Robusta prices rose 1.7% to 169.39 US cents/lb, while Brazilian Naturals fell 7.4% to 272.01 US cents/lb.
  • US certified Arabica stocks fell 13.3% to 0.41 million bags, the lowest since February 2024. London Robusta stocks rose 4.8% to 0.68 million bags.
  • Global green bean exports fell 4.1% to 10.8 million bags in May 2026, driven by a 17.2% drop in Brazilian Naturals. Robusta exports rose 4.8%.
  • The Strait of Hormuz closure added 10-14 days to shipping routes, raising fuel costs 68% and fertilizer prices 25%.
  • The USDA forecast a record Brazilian 2026/27 crop at 71.9 million bags (+14%), while Rabobank raised its global Arabica surplus estimate by 35.7%.

The ICO Composite Indicator Price averaged 248.90 US cents per pound in June 2026. This was a 2.8% decrease from May 2026.

Prices continued their downward trend in early June. They fell to 231.96 US cents/lb on June 9, the lowest level in nearly two years. However, prices then rebounded sharply by 17.4%.

They reached a two-month high of 272.39 US cents/lb at the end of the month. Weather emerged as the principal driver of coffee price dynamics in June.

The Colombian Milds and Robustas recorded modest gains. The Colombian Milds rose 0.4% to 324.60 US cents/lb. Robustas increased 1.7% to 169.39 US cents/lb.

In contrast, the Other Milds declined 2.4% to 307.83 US cents/lb. The Brazilian Naturals fell 7.4% to 272.01 US cents/lb. London Robusta stocks rose 4.8% to 0.68 million bags.

US certified Arabica stocks fell 13.3% to 0.41 million bags. This was the lowest level since February 2024. The market became increasingly nervous as inventories tightened.

Super El Niño Fears Drive Rebound

Market sentiment shifted abruptly in June. Growing confidence that El Niño would develop into a Super El Niño halted the downward price movement on June 9.

The Japan Meteorological Agency and NOAA released reports on June 10 and 11. They indicated 67% confidence in a Super El Niño event, the highest confidence level on record.

These forecasts raised concerns about the potential impact on the 2026/27 coffee harvest. The effects vary across regions and seasons.

Reduced rainfall is expected in the Caribbean, Central America, and Mexico. Raised temperatures and reduced rainfall are forecast for northern Brazil and parts of South America.

Increased rainfall is expected in southern Brazil and Bolivia. More erratic rainfall and flooding are forecast for East Africa. Drought conditions are expected in Southeast Asia.

On June 17 and 24, Safras & Mercado reported that Brazil’s 2026/27 coffee harvest was progressing slowly. The harvest reached 39% and 44% completion, respectively.

The delay was concentrated in Arabica areas. Excess rainfall disrupted harvesting and drying operations, particularly in Minas Gerais. The 44% completion figure on June 24 was below the 51% recorded a year earlier and the five-year average of 47%.

On June 29, Somar Meteorologia measured 31.3 mm of rainfall in Minas Gerais. This was equivalent to 1,956% of the historical average for the period. The unusually high precipitation occurred during the normally dry season. It delayed harvesting and drying operations and raised concerns over bean quality.

Strait of Hormuz Disruptions Add Supply Pressure

The Strait of Hormuz was effectively closed from February 28. This forced Asia-Europe shipping routes to divert via the Cape of Good Hope. Transit times increased by 10 to 14 days.

Bunker fuel prices were up 68% from mid-to-late February. Container spot rates roughly doubled. Fertilizer prices increased 25%.

A gradual reopening occurred on June 22-23 following the U.S.-Iran agreement on June 17. This pushed Robusta prices to a one-week low. However, attacks on the Ever Lovely on June 25 and the Kiku on June 27 renewed geopolitical tensions within days. The associated premiums returned quickly.

Combined ICE-certified stocks fell to 1.09 million bags on June 30. This was the lowest level since February 2024. The decline signaled tighter availability of deliverable stocks. The market was left with limited buffers against unforeseen supply disruptions.

Supply Fundamentals and Bearish Factors

On June 1, the USDA forecast Brazil’s 2026/27 crop at a record level. The forecast was 14% above the previous season. Rabobank raised its 2026/27 global Arabica surplus estimate by 35.7%.

These forecasts reinforced previous positive reports. CONAB’s official second survey projected Brazil’s total crop at 66.7 million bags. Safras & Mercado projected a total crop increase of 13.4%.

In late May, the USDA revised its estimate of Vietnam’s 2025/26 output upwards to 31.7 million bags. It forecast production at 32.5 million bags for 2026/27. The dollar index stood at 101.6 during the week of June 22. This was close to a 15-month high, creating a headwind for coffee prices.

The arbitrage between the London and New York futures markets contracted by 13.3% to 100.86 US cents/lb in June 2026. Intra-day volatility of the I-CIP decreased by 0.2 percentage points to 8.6%.

Exports: Arabica Declines, Robusta Gains

Global green bean exports totalled 10.8 million bags in May 2026. This was a 4.1% decline compared to 11.26 million bags in May 2025. All coffee groups recorded declines except Robustas.

Robusta exports were up 4.8% to 4.34 million bags. This was driven mainly by Brazil, where exports surged by 195.6% to 0.61 million bags. The sharp rise reflects differences in harvest timing between the current and previous Robusta harvests.

Colombian Milds exports fell by 1.7% to 0.98 million bags. This marked the seventh consecutive month of negative growth. Other Milds shipments fell by 2.8% to 2.75 million bags. This was the first negative growth observed in coffee year 2025/26.

Brazilian Naturals exports fell by 17.2% to 2.73 million bags. This marked the 15th consecutive month of negative growth. The declines were primarily driven by Brazil and Ethiopia.

Total Arabica exports decreased to 6.46 million bags in May 2026. This was a 9.3% drop from 7.12 million bags in May 2025. As a result, Arabica’s share of total green bean exports fell to 60.2% from 64.0% a year earlier.

Table 1: Green Bean Exports by Coffee Group (million 60‑kg bags)

Coffee Group May 2025 May 2026 Change
Robustas 4.14 4.34 +4.8%
Colombian Milds 0.99 0.98 -1.7%
Other Milds 2.82 2.75 -2.8%
Brazilian Naturals 3.30 2.73 -17.2%

Exports by Region: Mixed Performance

Global exports of all forms of coffee decreased by 3.2% to 12.38 million bags in May 2026. The dynamics across the four regions were mixed.

Exports from Asia & Oceania were up 0.4% to 4.32 million bags. India led the growth with exports increasing 33.7% to 0.74 million bags. However, this was largely offset by decreases in Indonesia and Vietnam.

Africa’s exports decreased by 24.1% to 1.63 million bags. The contraction was driven largely by Ethiopia and Uganda. Their combined exports fell to an estimated 1.31 million bags from 1.77 million bags in May 2025.

South America’s exports increased by 4.3% to 4.29 million bags. This was the first monthly increase in 18 months. The upturn was driven mainly by Brazil, whose exports were up 4.3%.

The Caribbean, Mexico & Central America decreased by 3.8% to 2.14 million bags. This was the first negative growth in coffee year 2025/26, driven mainly by Nicaragua.

Soluble coffee exports increased by 3.6% to 1.51 million bags. Vietnam, Brazil, and India were the largest exporters. Roasted bean exports were up 10.8% to 0.07 million bags.

Frequently Asked Questions

What was the ICO composite price in June 2026?

The I-CIP averaged 248.90 US cents/lb in June 2026, a 2.8% decrease from May. However, prices rebounded sharply from a two-year low on June 9 to a two-month high by month-end.

What caused the price rebound in June?

Super El Niño fears (67% confidence) and excessive rainfall in Brazil (1,956% above average in Minas Gerais) slowed the harvest and raised quality concerns, reversing the downward trend.

How did coffee stocks perform in June?

US certified Arabica stocks fell 13.3% to 0.41 million bags, the lowest since February 2024. London Robusta stocks rose 4.8% to 0.68 million bags. Combined ICE-certified stocks fell to 1.09 million bags.

How did the Strait of Hormuz closure affect coffee prices?

The closure added 10-14 days to shipping routes, raising bunker fuel costs 68%, container spot rates by about 100%, and fertilizer prices 25%.

What were the export trends in May 2026?

Global green bean exports fell 4.1% to 10.8 million bags. Robusta exports rose 4.8%, while Brazilian Naturals fell 17.2%. Total Arabica exports were down 9.3%.

What was Brazil’s harvest outlook in June?

The USDA forecast a record 2026/27 Brazilian crop at 71.9 million bags (+14%). However, excessive rainfall in June slowed harvesting, with only 44% completed by June 24, below the five-year average of 47%.


Author: Qahwa World – London | Source: International Coffee Organization – Coffee Market Report, June 2026 | Date: July 2026

Ethiopia Coffee Revenue Tops 3 Billion

Source: Official government reports & Daily Coffee News analysis
Author: Qahwa World
Date: July 8, 2026

Ethiopia Coffee Revenue Tops 3 Billion

  • Ethiopia earned 3.1 billion dollars from coffee exports in a single year.
  • This represents a 719.6% increase compared to 20 years ago.
  • The country ranks third globally and first in Africa for coffee exports.
  • One year’s income exceeded the total of the previous 17 years combined.
  • Rising global demand for organic coffee opens new opportunities for Ethiopia.
  • A comparison with Brazil reveals Ethiopia’s competitive edge in sustainable farming.
  • The analysis recommends increased technical and financial support for farmers.

Ethiopia announced a historic achievement in its coffee sector. Export revenues surpassed the 3 billion dollar mark. This reflects a strategic transformation in farming and marketing policies.

Annual revenues reached 3.1 billion dollars. This surpasses the total earned over the previous 17 years. That total stood at only 3.3 billion dollars.

Historical Numbers Confirm Accelerated Growth

Official data compared current performance with past periods. The results showed enormous revenue growth. For example, 20 years ago, revenues were only 366 million dollars. Today, they stand at 3.1 billion dollars.

In addition, the net increase over 20 years exceeded 2.6 billion dollars. This translates to a growth rate of 719.6%. In contrast, income more than doubled within the last 5 years alone.

Ethiopian Coffee Export Revenue Comparison (in billions USD)
Period Revenue Net Increase Growth Rate
20 years ago 0.366 +2.634 719.6%
10 years ago 0.722 +2.278 315.5%
5 years ago 0.907 +2.093 230.7%
Current year 3.100

Strategic Opportunities Amid Brazil’s Crisis

Brazil, the world’s largest coffee producer, faces severe climate challenges. Production in Minas Gerais state has been heavily damaged. As a result, Brazil’s export capacity has declined.

In contrast, Ethiopia possesses unique natural advantages. It is the birthplace of Arabica coffee. Moreover, its farming relies on organic and forest-based systems. Therefore, it can fill the gap in European and Asian markets.

Organic Coffee and the Competitive Edge

Brazilian farmers are shifting to chemical fertilizers. They aim to quickly compensate for lost production. However, this reduces the quality of organic coffee.

Meanwhile, Ethiopian coffee remains natural and chemical-free. Furthermore, Ethiopia’s agroforestry system complies with new EU regulations. This strengthens its position in the global market. Consequently, the value of its exports continues to rise.

Required Steps to Maximize Gains

The report urged immediate action. First, increase productivity through technical support for farmers. Second, improve quality control to maintain global reputation. Third, provide affordable financing for sustainable agricultural projects.

In addition, leverage strong diplomatic ties with Asia. Especially China, which is a vast emerging market. Ultimately, this will enable Ethiopia to turn its origin advantage into true market dominance.

Frequently Asked Questions

What is Ethiopia’s current coffee export value?Ethiopia’s coffee exports reached 3.1 billion dollars last year, setting a new record.

What was the export value 20 years ago?The value was only 366 million dollars, which means a massive growth of over 700%.

What is Ethiopia’s global ranking in coffee exports?Ethiopia ranks third globally after Brazil and Colombia, and first in Africa.

How does Ethiopia benefit from Brazil’s crisis?It can compensate for the global supply shortage, especially in Europe and Asia, thanks to the quality of its organic and natural beans.

What are the main challenges for the sector?The sector needs more farmer support, better infrastructure, and increased funding to meet new market requirements.

Is Ethiopian coffee completely organic?Yes, the vast majority is grown naturally on small farms or in forests, without any chemical inputs.

Ethiopia Surpasses $3 Billion Coffee Export Target, Sets Sights on $6 Billion

Source: Ethiopian Ministry of Agriculture – Official Statement |
Author: Qahwa World |
Date: July 4, 2026

Ethiopia Surpasses $3 Billion Coffee Export Target, Sets Sights on $6 Billion

Key Takeaways:

  • Ethiopia has generated more than $3 billion in coffee export earnings during the 2025/26 fiscal year – the country’s strongest coffee export performance on record.
  • The achievement represents a significant increase from the $2.65 billion earned in the previous fiscal year.
  • The government is now targeting $6 billion in annual coffee export earnings within five years.
  • The strategy aims to raise average coffee productivity from about 9 quintals per hectare to 21 quintals per hectare.
  • Coffee remains Ethiopia’s largest agricultural export and a major source of foreign exchange earnings.
  • The initiative was developed in collaboration with the Ethiopian Coffee and Tea Authority.

Ethiopia has generated more than $3 billion in coffee export earnings during the 2025/26 fiscal year, surpassing a government target and marking the country’s strongest coffee export performance on record. This milestone comes as Ethiopia continues to cement its position as the birthplace of Arabica coffee and one of the world’s leading specialty coffee origins.

Announcing the milestone, Ethiopian Agriculture Minister Addisu Arega said the achievement reflects improvements in production, productivity and quality across the coffee value chain. The result represents a significant increase from the $2.65 billion earned in the previous fiscal year.

The Ambitious Target: $6 Billion Within Five Years

Speaking during discussions on a new national coffee development framework, Addisu said Ethiopia is targeting annual coffee export earnings of $6 billion within five years. The strategy aims to raise average coffee productivity from about 9 quintals per hectare to 21 quintals per hectare. The initiative, developed in collaboration with the Ethiopian Coffee and Tea Authority, seeks to accelerate productivity growth, improve quality standards and strengthen the country’s competitiveness in global coffee markets.

Fiscal Year Coffee Export Earnings Change
2024/2025 $2.65 billion
2025/2026 $3.0+ billion +13.2%
2030/2031 Target $6.0 billion +100%

Boosting Productivity: From 9 to 21 Quintals per Hectare

Raising productivity from 9 to 21 quintals per hectare represents a major transformation for the sector. This will require significant investment in improving agricultural practices, providing high-quality inputs, training farmers, and developing infrastructure. The strategy also includes improving quality standards to enhance the reputation of Ethiopian coffee in global markets and increasing competitiveness, especially in the specialty coffee segment for which Ethiopia is renowned.

Coffee: The Backbone of Ethiopia’s Economy and a Key Source of Foreign Exchange

Coffee remains Ethiopia’s largest agricultural export and a major source of foreign exchange earnings, supporting millions of smallholder farmers while reinforcing the country’s position as the birthplace of Arabica coffee and one of the world’s leading specialty coffee origins. This achievement represents an important step in Ethiopia’s strategy to strengthen coffee’s role in economic development and achieve ambitious growth targets.

The Road to $6 Billion: Challenges and Opportunities

Despite the significant achievement, Ethiopia’s coffee sector faces challenges including climate change, weak infrastructure in some areas, and the need to improve market access. However, opportunities are also substantial, especially with growing global demand for specialty coffee and Ethiopia’s renowned reputation in this field. The new strategy provides a clear roadmap to turn these opportunities into tangible reality, with a focus on quality, sustainability, and innovation.

Frequently Asked Questions About Ethiopia’s Coffee Export Achievements

Q: How much did Ethiopia earn from coffee exports in fiscal year 2025/2026?

A: More than $3 billion, the highest level ever recorded.

Q: What is Ethiopia’s new coffee export target?

A: Ethiopia is targeting $6 billion annually within five years.

Q: How does Ethiopia plan to achieve this target?

A: By raising average productivity from 9 quintals per hectare to 21 quintals, improving quality, and strengthening competitiveness.

Q: Why is coffee important to Ethiopia’s economy?

A: Coffee is Ethiopia’s largest agricultural export and a key source of foreign exchange, supporting millions of farmers.

Q: Which authority oversees coffee sector development in Ethiopia?

A: The Ethiopian Ministry of Agriculture, in collaboration with the Ethiopian Coffee and Tea Authority.

Ethiopia’s surpassing of the $3 billion coffee export mark is a milestone in the country’s history, reflecting ongoing efforts to improve production and quality. With the ambitious target of reaching $6 billion, Ethiopia is drawing a roadmap for its future as a global coffee power, while preserving its position as the birthplace of Arabica. The road is long, but the will and vision are strong.

Prepared and edited by: Qahwa World – Based on an official statement from the Ethiopian Ministry of Agriculture.

All rights reserved. Republication with attribution permitted.

Publication date: July 4, 2026

Infrastructure Challenges Threaten Brazilian Coffee Competitiveness Globally

Source: USDA Foreign Agricultural Service (FAS) |
Author: Qahwa World |
Date: June 18, 2026

Infrastructure Challenges Threaten Brazilian Coffee Competitiveness Globally

Key Takeaways:

  • Brazil, the world’s largest coffee producer and exporter, faces severe infrastructure challenges threatening its competitive position.
  • Transport infrastructure investment is only 0.13% of GDP, far below the minimum required 4%.
  • Over 65% of grain is transported by road, despite high costs that can reach 60% of the ton price.
  • Storage deficit estimated at 134 million tons, with storage capacity growing at 2% annually versus 4% production growth.
  • Coffee ranks first globally in production and exports, but transport and storage challenges threaten its quality and competitiveness.
  • The Northern Arc has become a strategic export corridor for coffee and grains, with its share growing from 12% to 35% since 2010.
  • Experts warn that the logistics network could become a binding constraint on agricultural growth by 2034 without sufficient investment.

Brazil, the world’s largest coffee producer and exporter, faces growing infrastructure challenges that threaten its competitive position in global markets. Despite being the world’s leading coffee producer, deteriorating logistics infrastructure and rising transport costs threaten to turn this competitive advantage into a heavy burden for Brazilian producers and exporters.

These challenges come at a critical time, as coffee cultivation in Brazil expands toward the North and Center-West regions, creating new production frontiers that require highways, railways, ports, warehouses, and logistics services beyond traditional routes. However, government investment in infrastructure remains woefully inadequate, threatening Brazilian coffee’s leadership in the global market.

Infrastructure Reality: Modest Investment, Massive Challenges

According to a report from the USDA Foreign Agricultural Service (FAS), Brazil’s transport infrastructure investment is only 0.13% of GDP, far below the minimum 4% that the Brazilian Association of Infrastructure and Basic Industries considers necessary to meet the country’s needs.

World Economic Forum data shows Brazil’s overall infrastructure score is just 29.8, far behind countries like Switzerland (94.8), Denmark (88.3), and Sweden (86). The International Institute of Management Development (IMD) ranks Brazil 58th out of 69 countries in infrastructure assessment.

Brazil has 1.7 million kilometers of roads, but only 216,000 kilometers are paved (12%). The country also has 30,000 kilometers of railways, with only one-third in commercial operation, and approximately 20,000 kilometers of navigable waterways.

Transport Sector Budget (BRL billion) Percentage
Road 11.8 65%
Aviation 3.8 21%
Waterways 2.0 11%
Railways 0.399 2%

Source: USDA FAS – Report BR2026-0026

Brazilian Coffee at the Heart of the Crisis: World No. 1 Under Pressure

Brazil ranks first globally in production and exports of coffee, along with sugar, orange juice, and soybeans. However, Brazilian coffee, a vital part of agricultural exports, faces logistical challenges that could affect its quality and competitiveness in global markets.

According to the report, Brazilian coffee exports to the United States alone reached approximately $1.9 billion in 2025, with a volume of 293,400 tons. Santos Port is the largest exporter of coffee to the US, shipping $1.6 billion and 241,000 tons.

Transport and storage challenges threaten these figures. Transport costs can reach 60% of the ton price for corn and 25% for soybeans due to long distances of 1,500 to 2,000 kilometers to reach ports. Coffee faces the same challenges, relying heavily on long-distance road transport, which increases costs and affects quality.

Road Dependence: High Costs and a Widening Storage Gap

Approximately 65% of grain transport in Brazil relies on roads, while railways account for 22% and waterways only 9%. This excessive dependence on road transport raises costs and creates bottlenecks during harvest seasons. Data indicates that approximately 70,000 additional trucks are used more than necessary to move agricultural crops in Brazil.

Regarding storage, Brazil suffers from a massive deficit. Total storage capacity is 202 million tons, but agricultural production far exceeds this capacity. Storage capacity grows at 2% annually, while production grows at 4%, continuously widening the gap. The national storage deficit is estimated at approximately 134 million tons against total grain production of 357 million tons.

This storage shortage forces producers to offload their harvests without delay, leading to concentrated supply in short windows, lower prices, and increased pressure on ports and freight networks.

Northern Arc: Strategic Hope and Promising Growth for Brazilian Coffee

The Northern Arc represents one of the strategic solutions to reduce pressure on traditional ports in the South and Southeast. The corridor’s share of grain exports doubled from 12% in 2010 to 35% in 2024. Estimates suggest the Northern Arc provides a competitive advantage of up to $7.82 per ton for soybean shipments to China compared to Santos Port.

According to the report, private sector investment of approximately BRL 46 billion is expected in Northern Arc ports and terminals. However, these investments face regulatory and environmental challenges that hinder their timely implementation.

Railways: Promising Solutions and Continuing Challenges

Estimates indicate that long-distance rail transport can reduce freight costs by 15 to 25% compared to road transport. Brazil is working on developing a new railway network, including the Mato Grosso Railway (FMT) spanning 743 kilometers, and the Nova Ferroeste project connecting agribusiness areas in the Center-West and South to Paranaguá Port.

However, challenges remain significant. Of 70 authorizations issued between 2013 and 2019, 21 terminals never entered operation within the five-year legal deadline due to environmental, financial, and legal obstacles.

Expert Warning: 2034 as a Critical Turning Point for Brazilian Coffee

Industry experts warn that without sufficient investment, Brazil’s logistics network could become a binding constraint on the growth of the Brazilian coffee sector by 2034. The Brazilian Association of Infrastructure and Basic Industries estimates that Brazil needs to invest approximately BRL 242 billion annually to develop adequate transport and logistics infrastructure across road, rail, waterway, and air sectors.

The report indicates that inflation, fuel prices, and rising input costs such as tires and tolls have pushed transportation expenses higher, steadily undermining the competitiveness of Brazilian producers in global markets.

Impact on the Global Coffee Market: Risks and Opportunities

If Brazil’s infrastructure challenges continue unaddressed, this could lead to:

  • Higher global coffee prices: Due to increased transport and storage costs.
  • Declining quality of Brazilian coffee: Resulting from transport delays and poor storage.
  • Loss of market share: To other producers like Vietnam, Colombia, and Ethiopia.
  • Supply volatility: Due to logistical bottlenecks during harvest seasons.

Conversely, these challenges could create opportunities for other producing countries to strengthen their global market share, especially if they can deliver high-quality coffee at competitive prices with reliable supply chains.

Frequently Asked Questions About Brazilian Coffee Infrastructure Challenges

Q: Why is infrastructure a major challenge for Brazil’s coffee sector?

A: Due to excessive dependence on road transport, weak investment in railways and waterways, insufficient storage capacity, and high transport costs that can reach 60% of the ton price.

Q: How much investment is needed to develop Brazil’s infrastructure?

A: The Brazilian Association of Infrastructure and Basic Industries estimates Brazil needs approximately BRL 242 billion annually to develop transport and logistics sectors.

Q: How does storage shortage affect coffee prices?

A: Storage shortage forces producers to sell their harvests immediately, increasing supply in short periods and lowering prices, while also increasing pressure on transport and ports.

Q: What is the Northern Arc and why is it important for Brazilian coffee?

A: A strategic logistics corridor connecting production regions in the North and Center-West to ports in the North and Northeast, offering a competitive advantage of up to $8 per ton compared to traditional southern ports.

Q: When is the greatest risk for Brazilian coffee?

A: Experts warn that the logistics network could become a binding constraint on agricultural growth by 2034 without radical infrastructure investment.

Brazil, the global coffee giant, faces infrastructure challenges that threaten its market leadership. Between agricultural expansion into new regions and insufficient investment, the future of Brazilian coffee hangs on political will and private investment. Meanwhile, coffee lovers worldwide watch closely as this sensitive issue may reshape the global coffee production and export map in the coming decade.

Prepared and edited by: Qahwa World – Based on USDA Foreign Agricultural Service (FAS) report BR2026-0026, issued June 16, 2026.

All rights reserved. Republication with attribution permitted.

Publication date: June 18, 2026

International Coffee Organization Releases Coffee Market Report for May 2026

Source: International Coffee Organization (ICO) – May 2026 Report |
Author: Qahwa World |
Date: June 13, 2026

International Coffee Organization Releases Coffee Market Report for May 2026

Key Takeaways:

  • The ICO Composite Indicator Price (I‑CIP) averaged 256.05 US cents/lb in May 2026, down 3.8% from April.
  • Brazilian Naturals fell 6.4% to 293.73 US cents/lb, while Robustas rose 1.1% to 166.51 US cents/lb.
  • ICE‑certified Arabica stocks fell 13.5% to 0.48 million bags – a multi‑month low.
  • CONAB raised its Brazil 2026/27 production forecast to a record 66.7 million bags, with Arabica up 28% y/y.
  • Global green bean exports declined 1.9% in April 2026 to 10.51 million bags, while Robusta exports rose 11.2%.
  • Vietnam’s April 2026 exports jumped 12.1% to 3.41 million bags – the country’s largest April volume on record.
  • The New York–London futures arbitrage narrowed 13.1% to 116.39 US cents/lb, reflecting improved Brazil arabica prospects.

The International Coffee Organization (ICO) published its monthly coffee market report for May 2026, showing a continued downward drift in prices as expectations of ample supply strengthened. The ICO Composite Indicator Price (I‑CIP) averaged 256.05 US cents/lb in May 2026, a 3.8% decrease from April 2026. The market continued to react to an improved supply outlook, reinforced by CONAB’s reaffirmation of a record outlook for Brazil’s production in crop year 2026/27.

Despite the decline, prices remain relatively elevated by historical standards. The drop reflects growing market expectations of a possible global surplus in coffee year 2026/27, combined with harvest pressure from Brazil and persistent backwardation in financial markets.

Group Indicator Performance: Arabicas Decline, Robustas Edge Up

Colombian Milds averaged 323.45 US cents/lb in May 2026, down 3.3% from April. Other Milds fell 4.8% to 315.42 US cents/lb. Brazilian Naturals dropped 6.4% to 293.73 US cents/lb – the steepest decline among the groups. In contrast, Robustas rose 1.1% to 166.51 US cents/lb.

On the futures markets, New York arabica futures fell 5.8% to 268.18 US cents/lb, while London robusta futures gained 0.8% to 151.79 US cents/lb. The arbitrage between the two futures markets contracted by 13.1% to 116.39 US cents/lb, highlighting in particular the improving prospects for arabica production in Brazil.

Group May 2026 (US cents/lb) Change vs April
ICO Composite 256.05 -3.8%
Colombian Milds 323.45 -3.3%
Other Milds 315.42 -4.8%
Brazilian Naturals 293.73 -6.4%
Robustas 166.51 +1.1%

Certified Stocks at Multi‑Month Lows

ICE‑certified robusta stocks fell 0.1% from April to May 2026, closing the month at 0.64 million bags. US‑certified arabica stocks also declined, dropping 13.5% to 0.48 million bags – the lowest level in months. The continued drawdown in certified stocks suggests persistent market uncertainty, as nearby contract premiums are not yet high enough to incentivize deliveries into certified warehouses.

CONAB Forecast: Record Brazil 2026/27 Crop

In mid‑May, Brazil’s National Supply Company (CONAB) released its second crop survey. It raised the total 2026/27 production forecast by about 0.5 million bags to a record 66.7 million bags. Arabica production was increased by 1.67 million bags to 45.8 million bags (+28% y/y). Robusta production was cut by about 1.2 million bags to 20.9 million bags (still a +0.8% y/y increase). CONAB also reported a 3.9% increase in coffee area to 2.34 million hectares, with yields rising to 34.4 bags per hectare. However, CONAB noted that carry‑over stocks remain low and highlighted continued growth in global demand, which tempered some of the market’s bearish sentiment.

Green Bean Exports: Overall Decline, Robusta Growth

Total global green bean exports reached 10.51 million bags in April 2026, down 1.9% from 10.71 million bags in April 2025. All coffee groups recorded declines except Robustas. Details:

  • Colombian Milds: down 14.0% to 0.78 million bags.
  • Other Milds: down 1.1% to 2.31 million bags.
  • Brazilian Naturals: down 14.8% to 2.91 million bags.
  • Robustas: up 11.2% to 4.50 million bags.

As a result, the Arabicas’ share of total green bean exports for the first seven months of coffee year 2025/26 fell to 60.4%, down from 64.2% in the same period a year earlier.

Group April 2026 (million bags) Change vs April 2025
Colombian Milds 0.78 -14.0%
Other Milds 2.31 -1.1%
Brazilian Naturals 2.91 -14.8%
Robustas 4.50 +11.2%

Regional Performance: Asia & Oceania Lead Growth

Total exports of all forms of coffee (green, soluble, roasted) fell 0.9% to 12.05 million bags in April 2026 compared with 12.17 million bags in April 2025. Regional dynamics were mixed:

  • Asia & Oceania: Up 7.3% to 4.64 million bags, led by Vietnam. Vietnamese exports jumped 12.1% to 3.41 million bags – the country’s largest April export volume on record.
  • Africa: Down 22.1% to 1.54 million bags, driven by sharp declines in Ethiopia and Uganda.
  • South America: Down 1.2% to 3.99 million bags, with Colombia recording its fifth consecutive monthly decline.
  • Caribbean, Mexico & Central America: Up 3.3% to 1.88 million bags, led by Honduras (+23.0%).

Price Volatility and El Niño Risks

The intra‑day volatility of the I‑CIP averaged 8.8% in May 2026, down 0.2 percentage points from April. Volatility for Brazilian Naturals and Robustas also declined, while Colombian Milds volatility increased slightly. On the futures markets, New York arabica volatility stood at 10.2%, and London robusta volatility at 10.1%.

The US National Oceanic and Atmospheric Administration (NOAA) estimates an 82% probability that El Niño conditions will emerge between May and July, with a 67% chance of a “Super El Niño”. Such a pattern could delay Brazil’s September‑October 2026 flowering rains, potentially damaging the 2026/27 crop. However, the impact of El Niño in Brazil is complex – it can be positive or negative depending on region, intensity, and timing.

Frequently Asked Questions About the ICO May 2026 Coffee Market Report

Q: What is the ICO Composite Indicator Price?

A: It is a weighted average of the four ICO group indicator prices (Colombian Milds, Other Milds, Brazilian Naturals, and Robustas).

Q: Why did arabica prices fall while robusta prices rose in May 2026?

A: Arabica fell due to record Brazil crop expectations, while robusta demand remained strong amid Red Sea shipping disruptions.

Q: What do falling certified stocks indicate?

A: They suggest that nearby contract premiums are not high enough to encourage deliveries into warehouses, reflecting persistent market uncertainty despite surplus expectations.

Q: How could El Niño affect coffee prices?

A: A “Super El Niño” could delay flowering rains in Brazil and damage next year’s crop, which would support higher prices. But the effect varies by region.

Q: What is the expected global coffee surplus for 2026/27?

A: CONAB’s record Brazil crop points to a significant surplus, but low carry‑over stocks and strong demand may limit its size.

The global coffee market remains caught between large surplus expectations on one hand, and low inventories, El Niño risks, and supply chain disruptions on the other. The ICO’s May 2026 report confirms that 2026 will be a pivotal year for the world’s coffee balance.

Prepared and edited by: Qahwa World – Based on the International Coffee Organization (ICO) market report for May 2026 (CMR-0526).

All rights reserved. Republication with attribution permitted.

Publication date: June 13, 2026

Brazil Coffee Output to Reach Record 71.9M Bags

Author: Qahwa World – Brasília
Source: USDA Foreign Agricultural Service – Report BR2026-0025
Date: June 1, 2026

Brazil Coffee Output to Reach Record 71.9M Bags

Executive Summary

  • Brazil’s 2026/27 coffee production is forecast at 71.9 million 60‑kg bags, a 14% increase over the previous season.
  • Arabica output is expected to surge 25% to 47.5 million bags, ending five years of low harvests.
  • Robusta (conilon) production is forecast at 24.4 million bags, a slight decline from 25 million bags due to cooler weather and excess rain in some regions.
  • Exports for 2026/27 are projected to jump 30% to 49 million bags, supported by the record crop.
  • However, low stocks and fears of an El Niño event are making exporters cautious and holding back deals.
  • Domestic consumption remains stable at 22.39 million bags, with a 0.5% annual increase.
  • The “Zero Crop, 100% Crop” management technique is helping farmers optimize yields and reduce costs.

Brazil is set to produce a record 71.9 million 60‑kg bags of coffee in the 2026/27 season. This is a 14% increase over the previous cycle. The outlook is especially bright for arabica coffee.

Optimal weather in major growing regions has driven the recovery. The record crop follows five years of low arabica production caused by adverse conditions.

Exports are expected to surge 30% to 49 million bags. However, exporters remain cautious. They are holding back on deals because of low stocks and uncertainties about a possible El Niño event.

El Niño could affect the end of the current harvest and the 2027/28 cycle. These factors are strongly influencing coffee prices in the Brazilian market.

Production Outlook

The positive biennial cycle is a key driver. Arabica trees naturally produce more in alternating years. This year is a high‑yield year.

Favorable weather conditions and rising global prices have also encouraged farmers to expand their coffee areas. Technology has enabled higher planting density per hectare.

As a result, total coffee production is forecast at 71.9 million 60‑kg bags. This is a 14% increase from the 63 million bags estimated for 2025/26.

The National Supply Company (CONAB) projects a slightly lower figure of 66.7 million bags. The Brazilian Institute of Geography and Statistics (IBGE) projects 65.1 million bags.

Both official agencies use different methodologies. They have historically provided lower estimates than the USDA.

Arabica and Robusta Performance

Arabica production is forecast to reach 47.5 million bags. This is a 25% increase over the previous cycle. The growth is driven by the positive biennial cycle and expanded cultivated area.

Technological improvements in crop management also played a role. Milder temperatures before flowering supported good crop development.

In contrast, robusta (conilon) production is forecast at 24.4 million bags. This is a slight decline from the 25 million bags estimated for 2025/26.

Colder weather and periods of excessive rainfall reduced yields in some main producing regions. The strong growth of the 2025/26 harvest also made it difficult to sustain the same level of production.

Producers are increasingly worried about climate change. Many are adjusting their practices, seeking more shaded areas, and looking for resilient varieties.

Regional Performance

Minas Gerais remains Brazil’s largest coffee‑producing state. It is forecast to harvest 34.1 million bags in 2026/27, up from 26.7 million in 2025/26.

The increase is due to the positive biennial cycle and better rainfall distribution. Rainfall was especially good before flowering and through March.

Espírito Santo, the second‑largest producer, is forecast at 21.4 million bags. Arabica production there is expected at 4.4 million bags, while robusta accounts for 17 million bags.

São Paulo, which grows only arabica, saw growth of more than 15% over the previous cycle, despite varied weather conditions.

Bahia has now become the second‑largest robusta producer, surpassing Rondônia. Its growth comes from advanced technology and high‑performance irrigated areas.

Rondônia is expected to see a 19% increase in robusta production. Favorable weather and the renewal of crops with higher‑yielding clonal plants are the main reasons.

Table 1: Brazilian Coffee Production by State (million 60‑kg bags)

State 2025/26 2026/27 Change
Minas Gerais 26.7 34.1 +27.7%
Espírito Santo 20.9 21.4 +2.4%
São Paulo 4.8 5.5 +14.6%
Bahia 4.7 5.2 +10.6%
Rondônia 2.3 2.8 +21.7%

Prices and Production Costs

Arabica prices rose sharply at the end of 2025 due to limited supply. However, prices started to decrease with the forecast of a larger harvest.

In April 2026, arabica coffee averaged BRL 1,811.87 (USD 360.03) per 60‑kg bag. This was a 5% drop from March and a 28% drop from April 2024.

Robusta prices fell even more. In April 2026, robusta traded at BRL 917.05 (USD 182.26). That was a 10% monthly drop and a 46% drop from April 2025.

Fears of an El Niño event have dampened sales activity. Many producers who were liquidating their remaining stocks are now holding back.

Production costs remain high. Fertilizer prices have risen, and freight costs have increased due to higher diesel prices. Diesel climbed about 24% in March 2026.

To cope, many farmers are adopting the “Zero Crop, 100% Crop” technique. This method divides farms into two plots and alternates skeleton pruning.

As a result, farmers focus only on the plot in its high‑yield phase. The system also increases organic matter and reduces fertilizer needs.

Domestic Consumption and Exports

Brazil’s domestic coffee consumption is forecast at 22.39 million bags for 2026/27. This is a slight 0.5% increase over the previous year.

Consumption declined by more than 2% in 2025 due to high prices. However, it recovered in early 2026 as supermarket prices dropped.

In the first four months of 2026, consumption rose 2% compared to the same period in 2025. The average Brazilian drinks about 3.8 cups of coffee per day.

Exports for 2026/27 are forecast to jump 30% to 49 million bags. This is based on the record harvest. However, low stocks have prevented even higher volumes.

Between January and April 2026, Brazil exported 11.5 million bags, a 24% decrease from the same period in 2025. April exports increased 1.2%, signaling a gradual recovery.

Germany remains the top buyer of Brazilian coffee, followed by the United States, Italy, Japan, and Belgium. The United States holds over 30% of the market share for Brazilian coffee imports.

Specialty coffees accounted for almost 18% of total exports in early 2026, though that volume was 36% lower than the same period in 2025.

Policy and Minimum Prices

The government has allocated BRL 7.37 billion for the 2026/27 Coffee Economy Defense Fund (FUNCAFE). The fund supports crop management, marketing financing, and working capital.

Minimum guaranteed prices for the 2026/27 harvest have been increased. Arabica now has a minimum price of BRL 792.53 per 60‑kg bag, a 20% rise from the previous season.

Robusta’s minimum price was set at BRL 556.97 per bag, a 12% increase. These prices are valid from April 2026 through March 2027.

Frequently Asked Questions

How much coffee will Brazil produce in 2026/27?

Production is forecast at 71.9 million 60‑kg bags, a 14% increase over the previous season.

Why is arabica production expected to surge?

The positive biennial cycle, expanded planted area, technological advances, and favorable weather are the main drivers.

Which Brazilian state produces the most coffee?

Minas Gerais is the largest producer, forecast at 34.1 million bags in 2026/27.

How will El Niño affect Brazilian coffee?

There is a 60% chance of El Niño between May and July 2026. It could negatively impact the 2027/28 harvest through higher temperatures and altered rainfall.

What is the “Zero Crop, 100% Crop” technique?

It is a management method that divides a farm into two plots and alternates skeleton pruning, allowing farmers to focus on high‑yield areas and reduce costs.

What are the main export destinations for Brazilian coffee?

Germany, the United States, Italy, Japan, and Belgium are the top buyers.


Author: Qahwa World – Brasília | Source: USDA Foreign Agricultural Service – Report BR2026-0025 | Date: June 1, 2026

Brazil Coffee Production to Hit Record 66.7 Million Bags in 2026

Author: Qahwa World – Brasília
Source: National Supply Company of Brazil (Conab), Cecafé, MDIC
Date: May 26, 2026This update covers expectations for a Brazil coffee production 2026 record, based on the latest reports and forecasts.

Brazil Coffee Output to Hit Record 66.7 Million Bags in 2026

Executive Summary

  • Brazil’s coffee production for the 2026 harvest is forecast at 66.7 million 60 kg bags, an 18% increase over 2025 and a new record, surpassing the 2020 harvest of 63.08 million bags.
  • Arabica production is expected to reach 45.8 million bags (+28%), while Robusta (Conilon) is forecast at 20.9 million bags (+0.8%).
  • Total planted area rises 3.9% to 2.34 million hectares, with national average productivity projected at 34.4 bags per hectare (+13%).
  • Minas Gerais, the largest producer, is forecast at 33.4 million bags (+29.8%). Espírito Santo follows with 18 million bags (+3%).
  • Brazil exported 11.5 million bags from January to April 2026, down 22.5% year-on-year due to low stocks, but April exports jumped 11.2% to 4.27 million bags, signaling recovery with the new harvest.
  • The USDA projects world production for 2025/26 at 178.8 million bags (+2%), with global demand rising 1.3% to 173.9 million bags, keeping prices elevated.

The National Supply Company of Brazil (Conab) released its second harvest survey on May 21, 2026, forecasting a record coffee production of 66.7 million 60 kg bags for the 2026 crop year, an 18% increase over the previous season.

If confirmed, this will be the largest harvest in Conab’s historical series, surpassing the 2020 record of 63.08 million bags.

The positive biennial cycle (higher production year for Arabica), the entry of new areas into production, and favorable weather conditions are the main drivers of this growth.

The total coffee area is expected to increase by 3.9% to 2.34 million hectares, comprising 1.94 million hectares of productive fields and 401,700 hectares of young plantations. National average productivity is projected to recover by 13% to 34.4 bags per hectare.

Arabica and Robusta Production

Arabica coffee production is forecast at 45.8 million bags, a 28% increase over 2025. This would be the third-highest Arabica harvest on record, behind only 2020 and 2018.

The expansion is driven by the positive biennial cycle, a larger area under production, and favorable weather conditions, particularly good rainfall distribution during the flowering period.

Robusta (Conilon) production is expected to reach 20.9 million bags, a modest 0.8% increase. While the harvested area is projected to grow to 388,220 hectares, average yields are estimated to drop 3.5% to 53.9 bags per hectare.

This decline reflects the high yields achieved in 2025 (a natural off-year for Robusta’s biennial cycle is less pronounced) and below-average temperatures in Espírito Santo during the production cycle, which affected plant physiology.

Production by State

Minas Gerais, the country’s largest coffee producer, is forecast to harvest 33.4 million bags (combining both species), a 29.8% increase over 2025.

This result is attributed to the positive biennial cycle combined with better rainfall distribution, especially in the months preceding flowering, as well as favorable weather through March, which provided good grain formation.

Espírito Santo, the second-largest producer, is expected to harvest 18 million bags, a 3% increase. Arabica production in the state is projected to rise 27.9% to 4.4 million bags, benefiting from the high biennial cycle.

However, Conilon production is forecast at 13.6 million bags, a 4.2% decrease due to the record-high performance in 2025 and below-average temperatures.

Bahia is expected to produce 4.7 million bags (+5.9%), supported by consistent weather, increased producer investment, and new areas entering production. São Paulo is forecast at 5.9 million bags (+24.6%), where only Arabica is grown. Rondônia is expected to produce 2.8 million bags (+19.4%), driven by the renewal of genetic material with more productive clonal plants and favorable weather.

Table 1: Brazil Coffee Production Forecast by State (2026, million 60 kg bags)

State 2026 Production (million bags) Change vs 2025 Main species
Minas Gerais 33.4 +29.8% Arabica
Espírito Santo 18.0 +3.0% Robusta (Conilon)
São Paulo 5.9 +24.6% Arabica
Bahia 4.7 +5.9% Both
Rondônia 2.8 +19.4% Robusta

Exports: April Recovery Signals New Harvest

According to the Brazilian Coffee Exporters Council (Cecafé), Brazil exported 4.27 million 60 kg bags in April 2026, an 11.2% increase compared to April 2025 (3.84 million bags). This was the first monthly increase in 2026, indicating the beginning of an export recovery as the new harvest enters the market.

“The rise in April reflects the start of the new harvest season in Brazil, which contributed to increased coffee availability for export,” said Horacio Miranda, analyst at hEDGEpoint. This upward trend supports Cecafé’s expectations of higher exports in the second half of the year.

In contrast, total exports from January to April 2026 reached 11.6 million bags, a 16.1% decrease compared to the same period in 2025. Export revenue for the first four months totaled $4.49 billion, down 14.4% year-on-year, according to MDIC data.

The decline in early 2026 reflects low domestic stocks resulting from limited production in previous years and strong export demand.

The main destinations in April were Germany, the United States, Italy, Belgium, and Japan.

Table 2: Brazil Monthly Coffee Exports (million 60 kg bags)

Month 2024 (million bags) 2025 (million bags) 2026 (million bags) Change (Apr 2026 vs Apr 2025)
January 3.2 3.1 2.9
February 2.8 2.9 2.4
March 3.0 3.2 2.6
April 3.4 3.84 4.27 +11.2%

Global Market Outlook

The United States Department of Agriculture (USDA) forecasts world coffee production for the 2025/26 cycle at 178.8 million 60 kg bags, a 2% increase over the previous cycle.

Despite the production increase, no significant price reductions are expected due to low carryover stocks from the previous cycle and a projected 1.3% increase in global demand to 173.9 million bags.

Brazil’s record harvest will play a major role in replenishing global stocks and meeting rising demand, particularly for high-quality Arabica beans.

Frequently Asked Questions

How much coffee will Brazil produce in 2026?

Brazil is forecast to produce 66.7 million 60 kg bags, an 18% increase over 2025, setting a new record.

What is driving the production increase?

The positive biennial cycle (high-yield year for Arabica), expansion of planted area (+3.9%), and favorable weather conditions, especially good rainfall distribution.

Which Brazilian state produces the most coffee?

Minas Gerais is the largest producer, forecast at 33.4 million bags, a 29.8% increase.

How are Brazil’s coffee exports performing?

April exports jumped 11.2% to 4.27 million bags, signaling recovery with the new harvest. However, January-April exports were down 16.1% due to low stocks.

What is the global coffee market outlook?

USDA projects world production at 178.8 million bags (+2%) and demand at 173.9 million bags (+1.3%), keeping prices elevated due to low stocks.


Author: Qahwa World – Brasília | Source: Conab, Cecafé, MDIC, USDA | Date: May 26, 2026

El Salvador Coffee Output Falls 7.5% to 542,000 Bags in 2026

Author: Qahwa World – San Salvador
Source: USDA Foreign Agricultural Service – Report ES2026-0004
Date: April 20, 2026

El Salvador Coffee Output Falls 7.5% to 542,000 Bags in 2026

Executive Summary

  • El Salvador coffee production for 2026/2027 is forecast at 542,000 60 kg bags, a 7.5% decrease from the revised 2025/2026 estimate of 586,000 bags.
  • The decline is driven by expected adverse weather from the El Niño phenomenon during flowering and harvest periods.
  • Planted area remains stable at 118,000 hectares, with no significant expansion due to climate vulnerability and limited credit access.
  • Exports are forecast at 543,000 bags in 2026/2027, slightly up from 535,000 bags. The United States remains the largest market with 50% share.
  • Domestic consumption reaches 339,000 bags, driven by a tourism boom and expanding coffee shop culture. Soluble coffee accounts for 88% of consumption.
  • Labor shortages from rural‑to‑urban migration continue to limit pruning, renovation, and harvesting activities.
  • Government programs focus on smallholders (less than 15% of area), but a large‑scale renovation plan remains unfunded.

The USDA Foreign Agricultural Service office in San Salvador estimates El Salvador coffee production for marketing year 2025/2026 at 586,000 60 kg bags.

For 2026/2027, production is forecast to fall to 542,000 bags, a 7.5 percent decrease, primarily due to the expected impact of the El Niño weather phenomenon during flowering and harvest periods.

The 2025/2026 crop was already affected by torrential rains in December 2025, which caused substantial berry drop at peak ripeness and dried out remaining berries, reducing both yields and bean quality during milling.

Planted area has remained stable at approximately 118,000 hectares across the past two marketing years and is expected to hold steady through 2026/2027.

Stagnation is largely attributed to climate vulnerability and limited access to credit, as private banks view coffee farming as a high‑risk investment and are reluctant to lend.

Faced with low profitability, many coffee farmers have transitioned to alternative crops such as cocoa and white corn.

Others have sold their land to real estate developers to cover debts. The government continues distributing new coffee seedlings, primarily to small‑scale farmers who represent about 15 percent of total coffee area, but without adequate financing many seedlings remain unplanted or fail to survive.

Producer Structure and Value‑Added Coffee

Smallest coffee producers (0‑3.5 hectares) represent most producers but account for a limited share of harvested area, which is more heavily concentrated among larger farms.

Value‑added production, including gourmet, specialty, and fair‑trade coffees, continues to generate additional income for a small but expanding group targeting niche markets.

These farmers focus on micro‑lot (5‑100 bags) and nano‑lot (fewer than 5 bags) sales, catering to specialty coffee buyers in the United States, Europe, and Asia.

In 2025, El Salvador held its annual Cup of Excellence competition, incorporating virtual cupping protocols for international judging. Geisha and Pacamara varieties dominated, with top‑scoring lots achieving ratings in the 90‑point range.

Inputs, Labor Shortages and Yields

The government operates a fungicide and biofertilizer distribution program primarily targeting small coffee farmers (with less than 7 hectares) to help manage coffee leaf rust outbreaks.

However, most producers do not benefit from this initiative and face limited access to financing for pest control and soil nutrition.

Seedling distribution includes varieties such as Cuscatleco, Marsellesa, Pacas, Pacamara, Sarchimor, and Anacafe 14.

A critical challenge is the continued shortage of agricultural labor. Migration to urban areas, driven by demand for construction labor, has reduced the rural workforce, leaving many farms without sufficient labor for pruning, weeding, fertilizer and pesticide application, and berry harvesting.

This scarcity undermines cultural practices and harvesting, negatively impacting productivity.

National coffee yields remain low, averaging 4.97 60 kg bags per hectare in 2025/2026. This underperformance is largely due to insufficient investment in a comprehensive renovation program. Current efforts focus primarily on small landholders (about 15 percent of planted area), limiting overall impact.

El Salvador is among the region’s most climate‑vulnerable countries, facing recurrent droughts and floods that disrupt flowering and cherry development, while also creating favorable conditions for pests and diseases such as coffee leaf rust, anthracnose, and coffee berry borer.

Domestic Consumption

Domestic coffee consumption for 2025/2026 is projected at 332,000 60 kg bags (green bean equivalent).

Increased international and local tourism due to improved security has boosted consumption.

Most of this consumption remains lower‑cost soluble coffee, largely imported from Mexico, Brazil, Colombia, and Nicaragua, alongside domestic brands such as Coscafe and D’Cafe.

Soluble coffee accounts for an estimated 292,000 bags, while roasted and ground coffee totals 40,000 bags.

For 2026/2027, consumption is expected to increase by 2 percent to 339,000 bags, driven by a surge in tourism.

In calendar year 2025, El Salvador recorded the world’s second‑highest percentage increase in tourism.

Coffee shop culture continues to expand, with new establishments in shopping malls and commercial centers. International chains such as Juan Valdez, Starbucks, and McCafe are growing alongside local brands like Viva Espresso and The Coffee Cup.

Retail demand for premium local varieties including Bourbon, Pacas, Pacamara, and Geisha continues to rise. Notably, El Salvador’s cafe Alquimia achieved 3rd place in the 2026 World Coffee Bar competition.

Despite this momentum, consumers continue to favor soluble coffee due to its affordability and convenience.

Limited marketing for higher‑quality roasted beans and price sensitivity sustain this preference.

The Salvadoran Coffee Institute (SCI) continues efforts to promote premium domestic coffee through initiatives such as National Pacamara Coffee Day and participation in international events like the Specialty Coffee Expo.

Exports and Key Markets

Coffee exports for 2025/2026 are estimated at 535,100 60 kg bags, a 12.6 percent increase from the previous year, driven by farmers taking advantage of high international prices and selling off accumulated stocks.

Exports are forecast to continue growing to 543,000 bags in 2026/2027, as prices are expected to remain high throughout the harvesting period.

The United States remains the largest export destination, accounting for approximately 268,570 bags, or 50 percent of total exports.

Belgium has emerged as the second‑largest destination with about 11 percent. Other key markets include Italy, Germany, Saudi Arabia, Japan, the United Kingdom, and Australia.

Premium prices for gourmet and specialty coffees continue to drive export incentives.

At the Cup of Excellence and other promotional events, top‑quality Salvadoran coffees are sold through global electronic auctions, often commanding prices $100‑$300 per hundredweight above spot market “Contract C” prices.

Table 1: El Salvador Coffee Exports (1,000 60 kg bags)

Destination 2025/2026 2026/2027 Share (2025/26)
United States 268.6 272.6 50.2%
Belgium 61.0 61.9 11.4%
Canada 26.8 27.2 5.0%
Italy 23.0 23.3 4.3%
Germany 22.5 22.8 4.2%
Japan 20.0 20.1 3.7%
Others 113.2 115.1 21.2%
Total 535.1 543.2 100%

Certification programs including Starbucks Café Practices, Fair Trade, UTZ, and coffee‑related geographical indications (GIs) are gaining traction.

SCI, in collaboration with six coffee regions, has established GIs for coffee produced in those areas. Certified coffee generally commands higher prices.

SCI has also trained local cuppers to obtain “Q” grade certification. Through Starbucks Café Practices, Salvadoran farmers can sell their coffee at prices roughly $50 above international “Contract C” prices. In 2024, NESCAFE announced plans to build a logistics facility to source and sell local coffee.

Imports and Stocks

In 2025/2026, Mexico surpassed Brazil as the main supplier of soluble coffee to El Salvador, with an expected 110,128 60 kg bags. Brazil is forecast to supply 101,915 bags, Colombia 18,161 bags, and the United States 6,750 bags of roasted and soluble coffee.

Total coffee imports are projected at 270,200 bags in 2025/2026 and 272,100 bags in 2026/2027, driven by a tourism boom and expansion of retail outlets and coffee bars.

Of the 2026/2027 total, 262,000 bags will be soluble coffee and 10,000 bags roasted coffee. Coffee stocks are estimated at 158,000 bags in 2025/2026, as farmers held back sales anticipating higher prices due to harvest delays and logistics issues at Port Acajutla. Stocks are forecast to decrease to 79,000 bags in 2026/2027 as producers capitalize on high prices.

Policy and Structural Challenges

The Salvadoran Coffee Institute (SCI) has implemented a pest monitoring program to help farmers manage coffee rust before severe damage occurs. Efforts have focused on renovating approximately 500 hectares in the northern coffee belt, adding two coffee quality control labs, and investing in molecular biology and somatic embryogenesis equipment.

However, government support primarily targets small farmers with less than 3.5 hectares, who represent less than 15 percent of total planted area.

A more effective solution would be a large‑scale replanting initiative focusing on medium‑sized farms that account for about 37 percent of area.

Many coffee trees are now over 25 years old and have surpassed their productive lifespan. Each year, over 7 million plants must be replaced to account for natural mortality.

According to the Salvadoran Coffee Association, approximately 30 million high‑quality, rust‑resistant plants are needed annually for the next 10 years to fully renovate the country’s coffee areas.

The sector’s challenges have led to a decline in jobs in coffee‑producing regions, contributing to rural migration.

For every 100,000‑quintal drop in coffee production (about 45,000 tons), an estimated 10,000 jobs are lost.

Additionally, more coffee farms are being abandoned or converted to basic grain production, exacerbating environmental challenges by reducing forestation and impairing water retention.

Financial challenges persist, with farmers still repaying debts under the Coffee Trust (FICAFE) program, established in 2001.

A grace period on capital payments has been extended through the end of 2026, but the sector remains under pressure.

Private banks are unwilling to offer loans due to high default risk driven by price volatility and diminishing yields.

Coffee farmers also face high processing costs, with mills currently charging around $100 per hundredweight of green bean equivalent to prepare coffee for export.

In 2019, the government proposed the Café‑Proyecto País program aimed at unifying coffee associations and developing a sustainability strategy, but lack of funding has delayed implementation.

In April 2021, a coffee rescue program was announced to restructure approximately $240 million in sector debt, create a coffee research institute, renovate 35,000 hectares, and promote local consumption, but fiscal constraints have delayed progress.

In January 2021, the government secured a $45 million loan from the Inter‑American Development Bank (IDB) to assist smallholder farmers through technical assistance and preferential loans, which also helped establish the Salvadoran Coffee Research Institute. However, much work remains.

Frequently Asked Questions

How much coffee will El Salvador produce in 2026/2027?

Production is forecast at 542,000 60 kg bags, a 7.5% decrease from the previous year, mainly due to El Niño.

What is the main export market for Salvadoran coffee?

The United States is the largest market, accounting for 50% of total exports, followed by Belgium (11%).

What are the biggest challenges facing El Salvador’s coffee sector?

Climate vulnerability (El Niño), labor shortages from rural migration, high input costs, limited credit access, and aging coffee trees.

How has domestic coffee consumption changed?

Consumption reached 332,000 bags in 2025/2026, driven by a tourism boom and expanding coffee shops. Soluble coffee accounts for 88% of consumption.

What is the average coffee yield in El Salvador?

Average yields are low at 4.97 60 kg bags per hectare, far below regional averages, due to lack of renovation investment.

What government programs support coffee farmers?

Programs include fungicide and biofertilizer distribution for smallholders, seedling distribution, and a $45 million IDB loan for technical assistance, but large‑scale renovation remains unfunded.


Author: Qahwa World – San Salvador | Source: USDA Foreign Agricultural Service – Report ES2026-0004 | Date: April 20, 2026
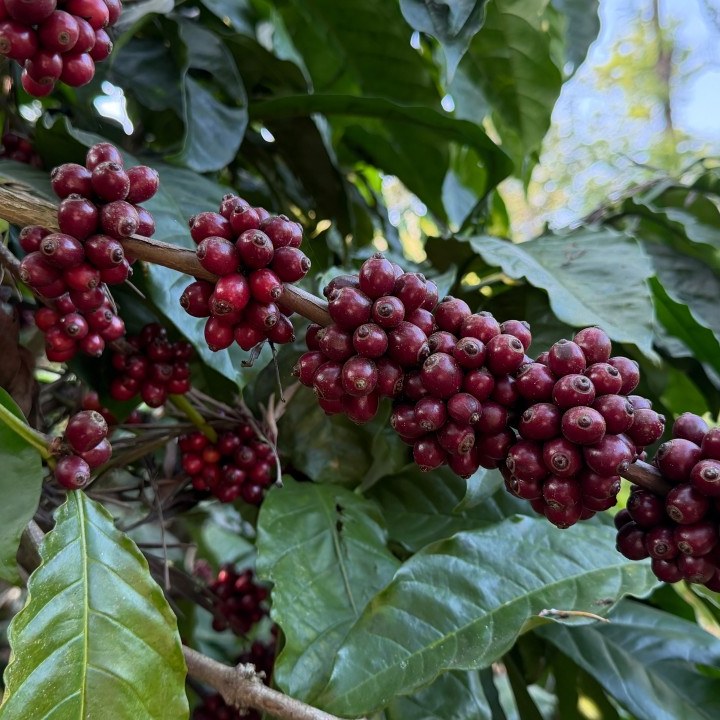
Guatemala Coffee Output Rises 3% to 3.13 Million Bags in 2026

Author: Qahwa World – Guatemala City
Source: USDA Foreign Agricultural Service – Report GT2026-0003
Date: April 16, 2026

Guatemala Coffee Output Rises 3% to 3.13 Million Bags in 2026

Executive Summary

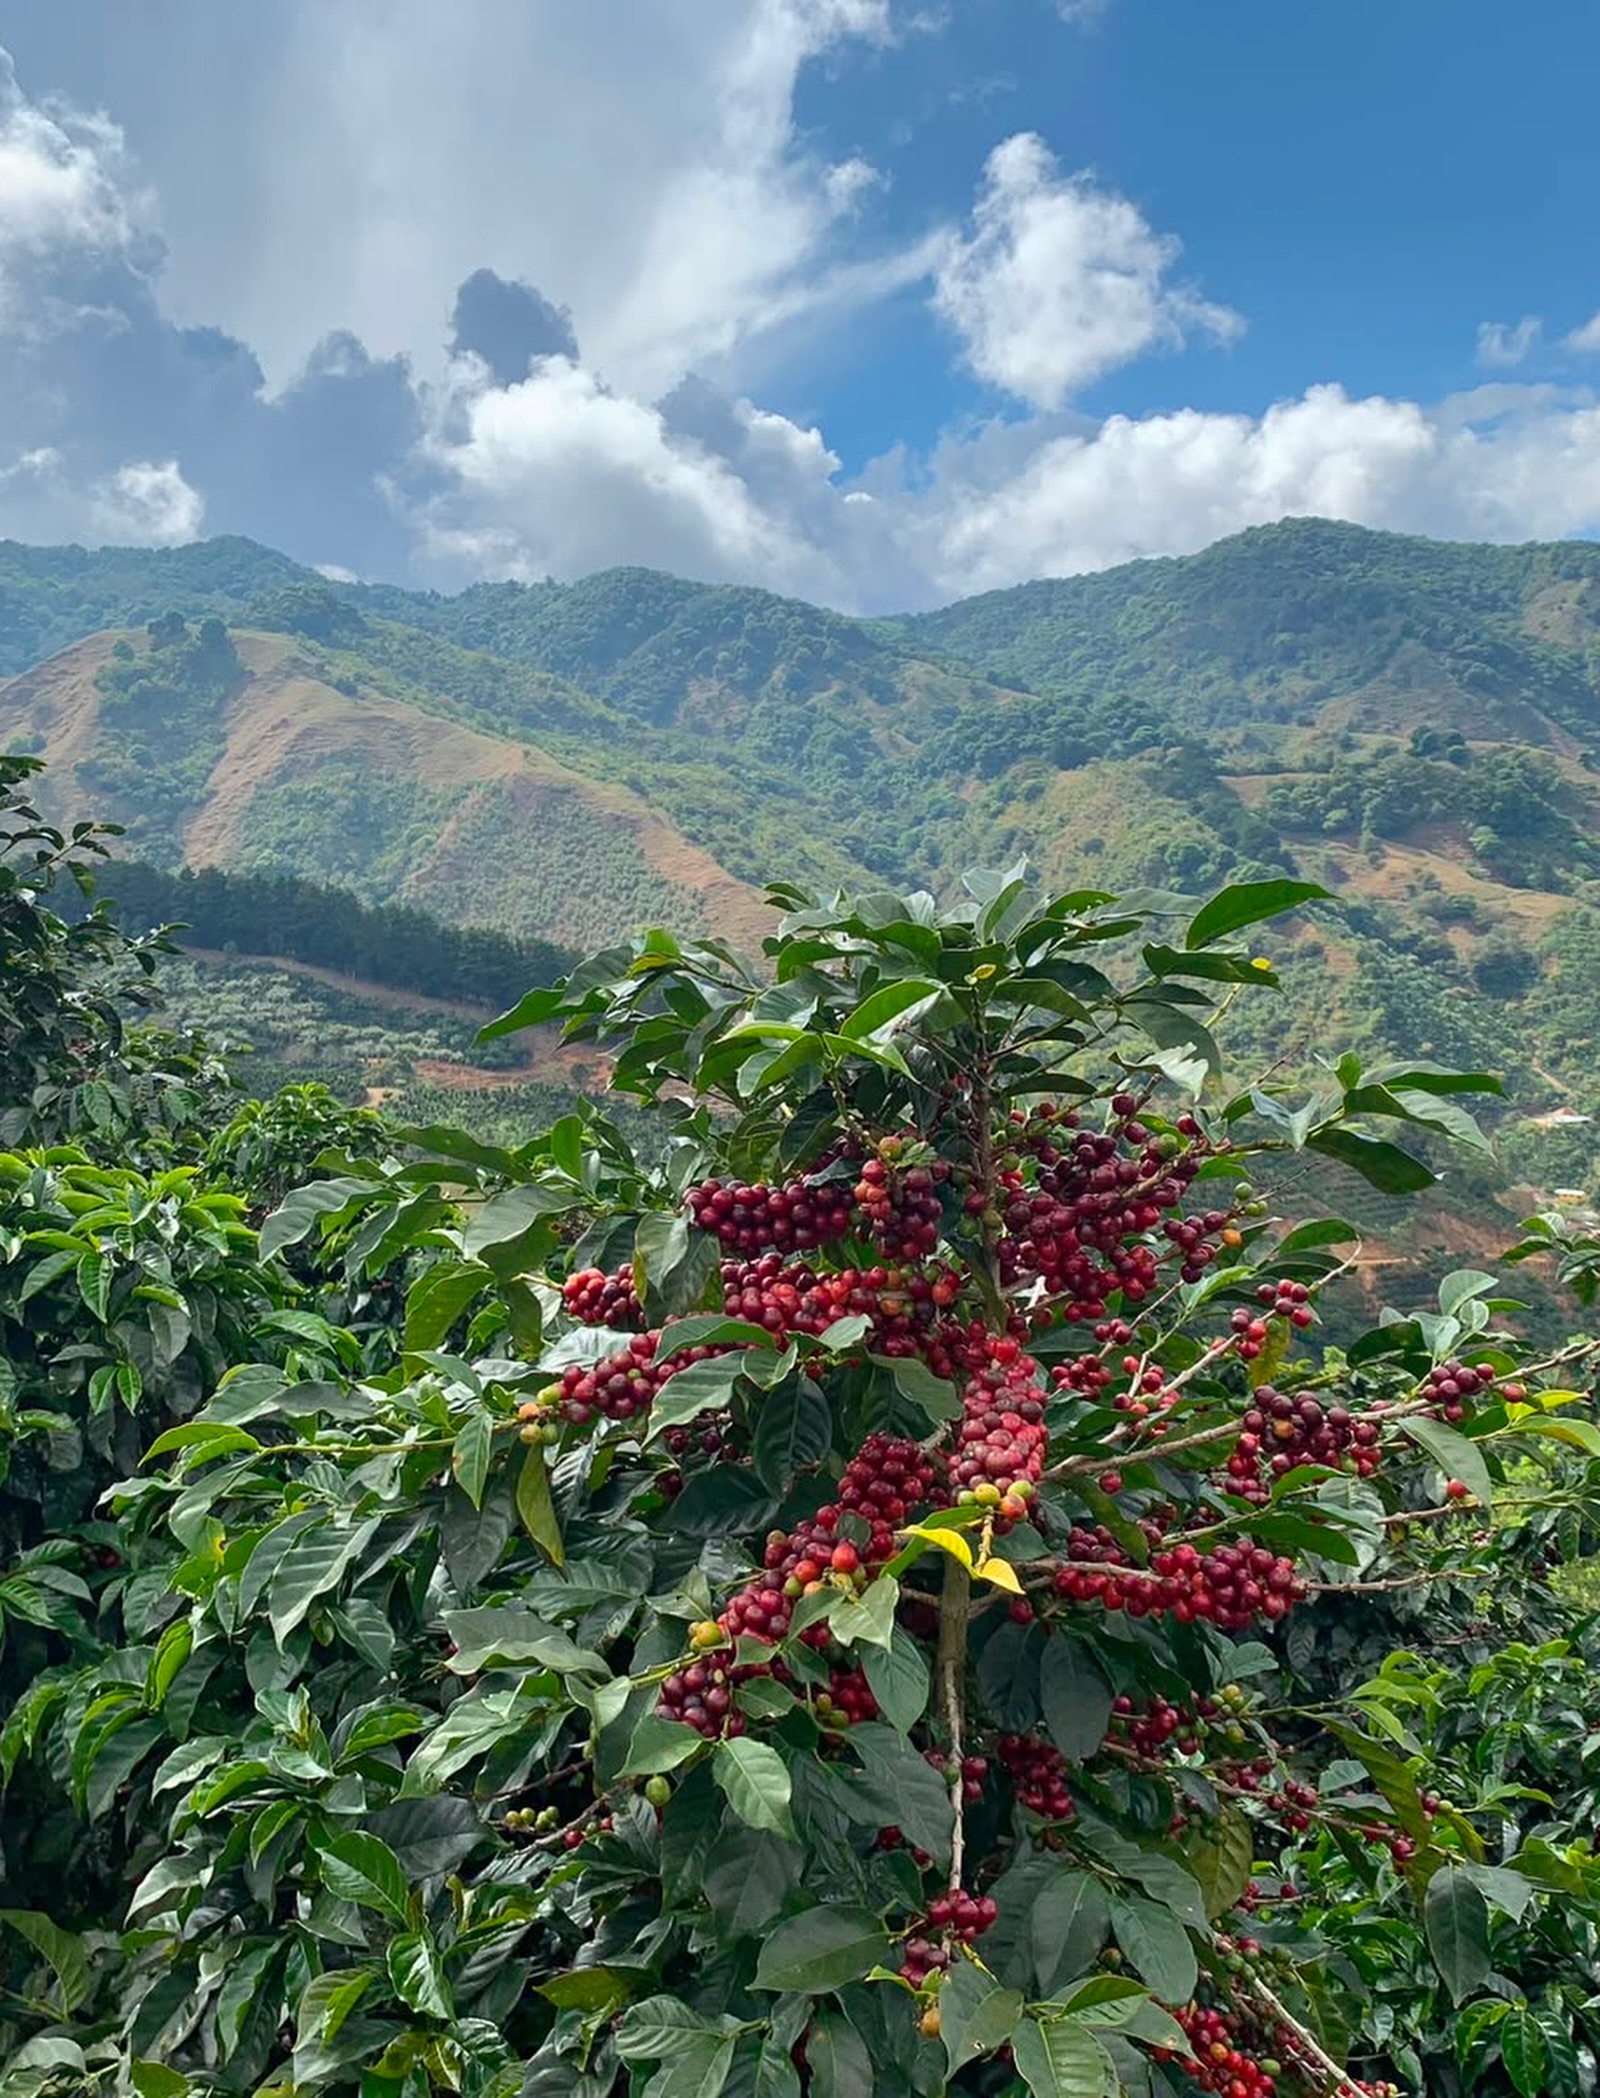
  • Guatemala coffee production for 2026/2027 is forecast at 3.13 million 60 kg bags, a 3.3% increase from the previous year.
  • Harvested area expands to 345,000 hectares, up 2%, supported by maturing trees and plantation renovation.
  • Arabica accounts for 98% of output; about one‑third of plantations are planted with rust‑tolerant hybrids.
  • Exports (including soluble and roasted) are forecast at 3.2 million bags. The United States holds a 42% market share.
  • Domestic consumption reaches 900,000 bags, with soluble coffee representing 67% of that total.
  • Rust pressure reached 20% incidence in early 2025; the coffee borer (Xylosandrus compactus) has been detected in four departments.
  • ANACAFE operates input programs and a trust fund that has granted $180 million in loans since 2001.

The USDA Foreign Agricultural Service office in Guatemala City forecasts Guatemalan coffee production for marketing year 2026/2027 at 3.13 million 60 kg bags (green bean equivalent), a 3.3 percent increase from the revised 2025/2026 estimate of 3.025 million bags. The growth is primarily driven by expanded harvested area and maturing trees entering production.

Harvested area is forecast at 345,000 hectares in 2026/2027, up 2 percent from 338,000 hectares in 2025/2026. The number of bearing trees is expected to rise from 1.628 billion to 1.662 billion.

Arabica varieties account for approximately 98 percent of planted area, grown almost entirely under shade. About one‑third of Arabica plantations have been renovated with rust‑tolerant hybrids.

The remaining 2 percent consists of Robusta varieties, which are grown at lower altitudes.

The National Coffee Association (ANACAFE) continues to play a key role in ensuring the availability of certified planting material. Catimor and Caturra varieties make up nearly half of total plantings, followed by Catuai, Sarchimor, Bourbon, and others.

Producer Structure and Yield Trends

The Guatemalan coffee sector is dominated by small‑scale producers. Small growers (97 percent of producers) produce roughly 266 60 kg bags of parchment coffee annually, with average yields of 17.29 bags per hectare. Medium growers (2.9 percent) produce up to 172.9 bags annually at 18.62 bags per hectare. Large growers (0.1 percent) produce more than 173 bags annually, with yields exceeding 21.28 bags per hectare.

Yields in 2026/2027 are projected to increase slightly to 9.45 60 kg bags per hectare, above the 9.33 bags estimated for 2025/2026 but below the 9.67 bags achieved in 2024/2025.

The slight improvement reflects normal weather variations, though rising input costs remain a concern. As of March 2026, oil prices in Guatemala had increased by 20 percent, which will affect fertilizer and chemical prices for the following season.

Pest and Disease Challenges

The 2024/2025 harvest experienced higher coffee rust pressure, with incidence reaching up to 20 percent during January through March. Those months recorded higher moisture and temperature than usual. ANACAFE maintains close monitoring of rust and other pests to recommend preventive controls.

In September 2025, ANACAFE reported the identification of the coffee borer Xylosandrus compactus (Eichhoff) in the departments of Zacapa, Retalhuleu, Quetzaltenango, and San Marcos at altitudes of 600 to 900 meters. The pest was first reported in 2024 on avocado and cedar but subsequently appeared scattered on some Robusta trees. ANACAFE has provided control measures, including natural and chemical controls, but manual control appears to be the most effective method to prevent spread.

Input Programs and Farmer Support

ANACAFE’s Sustainable Profit Program provides guidance on best agronomic practices, focusing on a progressive annual pruning management system over 3‑ to 5‑year cycles. In 2024/2025, more than 27,000 hectares were harvested under the program, with 52,565 hectares registered.

ANACAFE also operates an agricultural input program that leverages collective purchasing power to secure inputs at reduced prices. The 2026 inputs program includes biostimulants, fertilizers, foliar fertilizers, fungicides, organic products, and crop protection chemicals, with discounts ranging from $0.75 per 100 pounds on standard fertilizers to specific per‑liter prices for specialty products.

A coffee trust fund, created by Legislative Decree 31‑2001 and amended over time, granted loans totaling $180 million between 2001 and 2025. Beneficiary farmers have repaid $108 million in capital and $46 million in interest. Decree 4‑2019 extended the trust fund’s duration until October 23, 2051, enhancing banking services for the sector.

Domestic Consumption

Domestic coffee consumption is projected to reach 900,000 60 kg bags in 2026/2027, a 2.9 percent increase from the 2025/2026 estimate of 875,000 bags. Soluble coffee continues to grow at a faster pace (30 percent growth rate) and accounts for 67 percent of domestic consumption (600,000 bags). Roasted and ground coffee accounts for the remaining 33 percent (300,000 bags).

Exports and Key Markets

Guatemalan coffee exports (including bean, roasted, and soluble) are forecast at 3.2 million 60 kg bags in 2026/2027, a 7.4 percent increase from the revised 2025/2026 estimate of 2.98 million bags. Green coffee exports represent approximately 90 percent of total exports, while demand for soluble exports continues to increase.

The United States remains the main destination, with a 42 percent market share. Other significant markets include Japan, Canada, Belgium, Italy, and South Korea. By region, North America absorbs 52 percent of exports, followed by Europe (26 percent), Asia (20 percent), and the rest of the world (2 percent).

In 2024/2025, total export value reached $1.284 billion, with prices averaging above $300 per 60 kg bag. To improve the buying experience, customers can explore the website “Explore – Guatemalan Coffees,” which displays farm‑level information on the best coffees of the year, including location, regional classification, varieties, processing methods, and showcasing schedules.

Table 1: Guatemala Coffee Exports (1,000 60 kg bags)

Destination MY 2023/24 MY 2024/25 Share (2024/25)
United States 1,294 1,198 41.9%
Japan 308 330 11.5%
Canada 360 273 9.5%
Belgium 263 266 9.3%
Italy 165 155 5.4%
South Korea 147 111 3.9%
Germany 131 96 3.4%
Others 483 430 15.0%
Total 3,151 2,859 100%

Policy, Sustainability, and Trade Agreements

In calendar year 2025, coffee represented 3.3 percent of Guatemala’s GDP and was the main agro‑industrial export product, accounting for 8 percent of total agricultural exports. Coffee is grown in 261 of the country’s 340 municipalities and covers 3.5 percent of total cropland. ANACAFE, established under Decree 19‑69, is responsible for issuing export licenses and promoting the sector.

ANACAFE promotes compliance with international and national policies related to greenhouse gas reduction. Initiatives include promoting renewable energy, water resource management with treatment and re‑utilization of processing water, and active geospatial monitoring to prevent deforestation. Close to 99 percent of Guatemalan coffee plantations comply with the EU zero‑deforestation policy, supported by specific platforms developed by ANACAFE.

On November 18, 2025, Guatemala’s Congress ratified the free trade agreement with South Korea through Decree 18‑2025. South Korea has also completed its ratification. Under the agreement, green coffee was granted immediate market access, representing a significant opportunity for the coffee sector.

Domestic reference prices for washed Arabica coffee as of April 7, 2026, are: hard green bean $247.53 per 60 kg bag, strictly hard green bean $253.53, and specialty strictly hard $256.53. Cherry prices range from $32.72 to $38.93 per bag depending on grade.

Frequently Asked Questions

How much coffee will Guatemala produce in 2026/2027?

Production is forecast at 3.13 million 60 kg bags, a 3.3% increase from the previous year.

What is the main export market for Guatemalan coffee?

The United States is the largest market, accounting for 42% of total exports.

What pests and diseases affect Guatemalan coffee?

Coffee rust (reaching 20% incidence in early 2025) and the coffee borer (Xylosandrus compactus) detected in four departments.

What percentage of Guatemalan coffee is grown under shade?

Almost 98% of Arabica coffee is grown entirely under shade.

How much of Guatemala’s domestic consumption is soluble coffee?

Soluble coffee accounts for 67% of domestic consumption (600,000 out of 900,000 bags).

What is ANACAFE’s role?

ANACAFE is the National Coffee Association, established under public law to enhance coffee production, marketing, and exportation, and it issues export licenses.


Author: Qahwa World – Guatemala City | Source: USDA Foreign Agricultural Service – Report GT2026-0003 | Date: April 16, 2026

Vietnam Coffee Output Rises to 32.5 Million Bags in 2026

Author: Qahwa World – Ho Chi Minh City
Source: USDA Foreign Agricultural Service – Report VM2026-0016
Date: May 20, 2026

Vietnam Coffee Output Rises to 32.5 Million Bags in 2026

Executive Summary

  • Vietnam coffee production for 2026/2027 is forecast at 32.5 million 60 kg bags, comprising 31.4 million bags of Robusta and 1.1 million bags of Arabica.
  • Harvested area expands to 644,000 hectares, driven by replanting programs and price incentives from 2024-2025 peaks.
  • Exports are forecast at 28.95 million bags, up 2% from 2025/2026, with strong demand from Germany, Italy, the United States, and emerging Asian markets.
  • Domestic consumption continues to grow, reaching 5 million bags, supported by rising middle class and tourism.
  • Falling prices from recent peaks have prompted producers to release stocks, supporting strong export performance.
  • Fertilizer and fuel costs up 30%, labor costs up 33%, pressuring farmer income.
  • El Niño with 62% probability expected in mid-2026, threatening dry conditions in the Central Highlands.

The USDA Foreign Agricultural Service office in Ho Chi Minh City forecasts Vietnam coffee production for marketing year 2026/2027 at 32.5 million 60 kg bags, comprising 31.4 million bags of Robusta and 1.1 million bags of Arabica. This represents an increase from the revised 2025/2026 estimate of 31.7 million bags.

The increase is driven by production expansion following the price peaks of 2024-2025, replanting programs, and expansion by large private enterprises such as Hoang Anh Gia Lai Group and Vinh Hiep Co., Ltd.

Exports are forecast at 28.95 million bags in 2026/2027, up 2% from the revised 2025/2026 estimate of 28.5 million bags. The first half of 2025/2026 saw exports reach 15.7 million bags, a 27.5% increase year-on-year.

Domestic consumption continues to grow, forecast at 5 million bags in 2026/2027, up from 4.9 million bags. GDP grew above 8% in 2025, and tourism reached 21 million international visitors, boosting coffee demand.

According to the Ministry of Agriculture and Environment, Vietnam’s total coffee area has reached approximately 730,000 hectares. Harvested area for 2026/2027 is forecast at 644,000 hectares, up from 630,200 hectares in 2025/2026.

Improved productivity and climate-resilient varieties drive steady Robusta growth, while Arabica area remains stable. Replanted areas under the Coffee Replanting Program (2021-2023) will enter stable harvest phase with high-yield potential.

However, the Western Highland Agriculture and Forestry Science Institute warns that approximately 30% of current coffee area is 20 years or older and requires replanting or renewal to maintain productivity.

Rising Input Costs and Farmer Concerns

High coffee export prices in 2024-2025 created strong production incentives but also risks to long-term sustainability. Farmers increased input applications, often applying fertilizer beyond recommended levels, resulting in excess nitrogen, phosphorus, and potassium in some areas of the Central Highlands.

Early or excessive irrigation may increase coffee yield in the short term, but depletes groundwater and increases production costs over time. Local farmers report that production costs have increased significantly, with fertilizer and fuel rising approximately 30% and labor costs rising 33% compared to the previous year.

Farmers express concern about reduced rainfall and drought conditions in the Central Highlands. Precipitation fell below normal from January to March 2026 in major coffee-producing provinces including Dak Lak, Gia Lai, Kon Tum, Dak Nong, and Lam Dong.

NOAA forecasts a 62% probability that El Niño conditions will emerge during June to August 2026 and persist through at least the end of 2026. El Niño typically brings warmer and drier conditions to parts of Southeast Asia, which could reduce coffee productivity and production.

Sustainability and EUDR Compliance

Vietnam is steadily transforming from a quantity-focused coffee exporter into a globally competitive producer of high-quality, innovative, and sustainable coffee products. As of 2025, approximately 40% of Vietnam’s coffee area has achieved sustainability certification standards such as Rainforest Alliance, Fairtrade, 4C, and UTZ.

The Specialty Coffee Program, developed by MAE in 2021, continues to focus on improving bean quality through better farming practices, selective harvesting, and post-harvest processing techniques. This shift attracts attention from global buyers seeking distinctive flavor profiles and traceable origin stories.

MAE and coffee export companies are actively working to fulfill EU Deforestation Regulation (EUDR) requirements, which take effect in December 2026. However, challenges remain with more than 600,000 smallholder households involved in coffee production.

Intercropping and Crop Diversification

In recent years, many farmers in the Central Highlands converted portions of their coffee-growing areas to higher-value crops like durian, which can generate profits 2.5 to 3 times higher than coffee per unit area. However, the sharp rise in coffee export prices in 2024 reversed this trend, prompting farmers to return to coffee cultivation.

The traditional coffee monoculture model is gradually shifting toward intercropping systems, where farmers grow coffee alongside durian, avocado, macadamia, or pepper. While intercropping helps diversify farmer income, it reduces coffee tree density per unit area, complicating accurate acreage measurements.

Exports and Markets

Vietnam exported approximately 15.7 million bags in the first half of 2025/2026, a 27.5% increase compared to the same period in 2024/2025. Major markets demonstrated strong export growth, including Germany (up 46%), Italy (up 31%), the United States (up 37%), Spain (up 22%), Russia (up 35%), and Japan (up 19%).

Asian markets also recorded significant growth, including India (up 1,022%), Cambodia (up 473%), Thailand (up 56%), and China (up 50%). Soluble and roasted coffee exports account for approximately 13% of total exports, with forecast at 3.55 million bags in 2026/2027.

During the first half of 2025/2026, Laos was Vietnam’s largest coffee supplier, accounting for 45% of total imports, followed by Indonesia (19%), Brazil (16%), and Uganda (10%).

Prices and Stocks

The average export price reached $5,127 per ton in the first half of 2025/2026, down 9% compared to the same period of 2024/2025. In March 2026, the export price was $4,553 per ton, a 22% decrease compared to March 2025. However, coffee prices remain elevated compared to 2023/2024.

Domestic Robusta coffee prices in the Central Highlands averaged approximately VND 102,800 per kg in the first half of 2025/2026, a 16% decrease compared to the first half of 2024/2025.

Ending stocks for 2025/2026 are revised down to 689,000 bags based on stronger exports and higher domestic consumption. Stocks are forecast to continue declining to 489,000 bags in 2026/2027.

Table 1: Vietnam Coffee Production, Supply and Distribution (1,000 60 kg bags)

Item 2024/2025 2025/2026 2026/2027
Beginning Stocks 889 1,089 689
Arabica Production 1,000 1,200 1,100
Robusta Production 28,000 30,500 31,400
Total Production 29,000 31,700 32,500
Total Imports 1,200 1,300 1,250
Total Exports 25,200 28,500 28,950
Domestic Consumption 4,800 4,900 5,000
Ending Stocks 1,089 689 489

Frequently Asked Questions

How much coffee will Vietnam produce in 2026/2027?

Production is forecast at 32.5 million 60 kg bags, including 31.4 million bags of Robusta and 1.1 million bags of Arabica.

What is driving the increase in production?

Expansion in harvested area, replanting programs, and high price incentives from 2024-2025 peaks.

What are the main export destinations for Vietnamese coffee?

Major markets include Germany, Italy, the United States, Spain, Russia, Japan, and emerging Asian markets like India, Thailand, and China.

How are prices trending?

Export prices have declined 9% from the same period last year, and domestic Robusta prices are down 16%.

What is the El Niño risk for Vietnam’s coffee crop?

NOAA forecasts a 62% probability of El Niño emerging by mid-2026, which could bring drier conditions to the Central Highlands and reduce productivity.

How much of Vietnam’s coffee area is certified sustainable?

Approximately 40% of Vietnam’s coffee area has achieved sustainability certifications such as Rainforest Alliance, Fairtrade, 4C, and UTZ.


Author: Qahwa World – Ho Chi Minh City | Source: USDA Foreign Agricultural Service – Report VM2026-0016 | Date: May 20, 2026

Ugandan Coffee Output Rises Slightly to 7.2 Million Bags in 2026

Author: Qahwa World – Nairobi
Source: USDA Foreign Agricultural Service – Report UG2026-0001
Date: May 20, 2026

Ugandan Coffee Output Rises to 7.2 Million Bags in 2026

Executive Summary

  • Ugandan coffee production for 2026/2027 is forecast at 7.2 million 60 kg bags, up from 7.1 million bags.
  • Planted area expands to 595,000 hectares, driven by land use shift from timber to coffee in Masaka region.
  • Robusta accounts for 80% of output (6.0 million bags); Arabica 20% (1.1 million bags).
  • Exports forecast at 6.8 million bags, up 1.9%, with the European Union taking 73% of total exports.
  • Domestic consumption rises slightly to 335,000 bags, supported by hospitality sector growth.
  • Fertilizer prices up 21% for a 50‑kg bag, limiting farmer uptake.
  • Government plans gradual shift from green bean exports to processed coffee (roasted and soluble) to boost value addition.

The USDA Foreign Agricultural Service office in Nairobi forecasts Ugandan coffee production for marketing year 2026/2027 at 7.2 million 60 kg bags, up from 7.1 million bags in the previous season.

The increase is driven by expansion in area under production, supported by sustained high prices in recent years.

Coffee exports in 2026/2027 are projected to rise from 6.7 million to 6.8 million bags.

Domestic consumption is forecast to increase slightly to 335,000 bags, supported by growth in the hospitality sector and a gradual rise in coffee consumption, particularly in urban areas.

FAS Nairobi forecasts planted area in 2026/2027 at 595,000 hectares, up from 590,000 hectares in 2025/2026.

This growth is driven by a gradual shift in land use from timber production to coffee, particularly in the Masaka region.

Uganda’s smallholder coffee farmers typically farm on 0.5 to 2.5 hectares of land.

Small farms dominate the sector and account for about 90% of total production, while medium and large-scale estates contribute the remaining 10%.

Robusta Dominates Production

For 2026/2027, post forecasts robusta production at 6.0 million 60 kg bags and arabica production at 1.1 million bags.

The increase reflects marginal expansion in area planted, driven by prevailing high prices.

Favorable weather conditions, increased adoption of improved agronomic practices, and the maturation of high-yielding trees planted earlier further support growth.

Robusta accounts for approximately 80% of total national production, with arabica making up the remaining 20%.

Uganda’s main coffee-growing regions are the central, eastern, and western zones, with emerging production areas in the north.

Robusta is mainly grown in the central region, although cultivation is increasingly expanding into the north due to increased investment and land availability.

Arabica is mainly cultivated in high-altitude areas of the eastern and western regions.

Table 1: Uganda Coffee Production, Supply and Distribution (1,000 60 kg bags)

Item 2024/2025 2025/2026 2026/2027
Planted Area (1,000 HA) 580 590 595
Harvested Area (1,000 HA) 570 575 580
Robusta (1,000 bags) 5,670 5,815 6,025
Arabica (1,000 bags) 1,030 1,060 1,135
Total Production (1,000 bags) 6,700 6,875 7,160
Exports (1,000 bags) 6,350 6,700 6,830
Domestic Consumption (1,000 bags) 325 330 335
Ending Stocks (1,000 bags) 269 334 329

Fertilizer Costs and Pest Challenges

Fertilizer use among Ugandan coffee farmers remains low, although farmers are starting to adopt its use.

Medium and large-scale farmers account for most fertilizer applications, while a growing number of smallholders are beginning to incorporate fertilizer into their agronomic practices.

However, high costs continue to constrain broader uptake.

Prices of commonly used nitrogen and phosphorus-based fertilizers have increased by approximately 21% for a 50‑kilogram bag, limiting affordability for farmers.

Most smallholder farmers continue to rely primarily on mechanical and traditional control methods to manage pests and diseases.

However, there is a gradual increase in the use of agrochemicals, particularly pesticides, driven by persistent and increasingly severe pest and disease pressures.

The twig borer is the most common pest, while coffee rust is the most recurrent disease.

These challenges continue to affect yields and increase production costs.

Coffee production is largely rain-fed, with rainfall generally sufficient.

Irrigation is more relevant in areas with less reliable rainfall, including parts of the north and east, but adoption remains limited due to high capital and operational costs.

Exports and Markets

Uganda exports over 98% of its coffee as green beans.

Exports in 2026/2027 are forecast at approximately 6.8 million bags, up 1.9%, driven by sustained strong global demand.

The European Union remains Uganda’s main export destination, accounting for about 73% of total exports in 2024/2025.

Morocco and the United States each account for about 6%.

The United Kingdom, Switzerland, Australia, Turkey, and Ukraine each take about 1%, while other destinations collectively account for about 6%.

Uganda is increasingly expanding its reach into non-traditional markets, with Morocco and China gaining importance.

Post revised the 2025/2026 export estimate upward by 2.8% from 6.52 to 6.70 million bags to reflect additional exports to non-reporting destinations, particularly Sudan.

Policy Shift Toward Value Addition

Uganda plans to gradually reduce exports of unprocessed coffee in line with the country’s focus on value addition to achieve its ambitious tenfold growth strategy.

The government aims to attract investment in coffee processing activities to expand industries, increase export earnings, and create jobs across the value chain.

This would prioritize exports of processed coffee products such as roasted and soluble coffee over green beans.

However, officials indicate that the transition will occur gradually rather than through an immediate ban, allowing green bean exports to continue in the short to medium term as local processing capacity and supporting infrastructure expand.

In 2025, the government restructured the Uganda Coffee Development Authority, integrating its functions into the Ministry of Agriculture, Animal Industry and Fisheries.

Initial implementation has yielded mixed feedback, with some stakeholders reporting continued access to services with minimal disruption, while others indicate delays in service delivery.

Frequently Asked Questions

How much coffee will Uganda produce in 2026/2027?
Production is forecast at 7.2 million 60 kg bags, up from 7.1 million bags.

What is the breakdown between Robusta and Arabica?
Robusta accounts for 6.0 million bags (80%), while Arabica accounts for 1.1 million bags (20%).

What are the main export destinations for Ugandan coffee?
The European Union takes 73% of exports, followed by Morocco (6%) and the United States (6%).

How much have fertilizer prices increased?
Fertilizer prices have risen by approximately 21% for a 50‑kg bag.

What is Uganda’s policy on coffee exports?
Uganda plans to gradually reduce green bean exports and shift toward processed coffee (roasted and soluble) to boost value addition.


Author: Qahwa World – Nairobi | Source: USDA Foreign Agricultural Service – Report UG2026-0001 | Date: May 20, 2026