Vietnam Coffee Output Rises to 32.5 Million Bags in 2026

Author: Qahwa World – Ho Chi Minh City
Source: USDA Foreign Agricultural Service – Report VM2026-0016
Date: May 20, 2026

Vietnam Coffee Output Rises to 32.5 Million Bags in 2026

Executive Summary

  • Vietnam coffee production for 2026/2027 is forecast at 32.5 million 60 kg bags, comprising 31.4 million bags of Robusta and 1.1 million bags of Arabica.
  • Harvested area expands to 644,000 hectares, driven by replanting programs and price incentives from 2024-2025 peaks.
  • Exports are forecast at 28.95 million bags, up 2% from 2025/2026, with strong demand from Germany, Italy, the United States, and emerging Asian markets.
  • Domestic consumption continues to grow, reaching 5 million bags, supported by rising middle class and tourism.
  • Falling prices from recent peaks have prompted producers to release stocks, supporting strong export performance.
  • Fertilizer and fuel costs up 30%, labor costs up 33%, pressuring farmer income.
  • El Niño with 62% probability expected in mid-2026, threatening dry conditions in the Central Highlands.

The USDA Foreign Agricultural Service office in Ho Chi Minh City forecasts Vietnam coffee production for marketing year 2026/2027 at 32.5 million 60 kg bags, comprising 31.4 million bags of Robusta and 1.1 million bags of Arabica. This represents an increase from the revised 2025/2026 estimate of 31.7 million bags.

The increase is driven by production expansion following the price peaks of 2024-2025, replanting programs, and expansion by large private enterprises such as Hoang Anh Gia Lai Group and Vinh Hiep Co., Ltd.

Exports are forecast at 28.95 million bags in 2026/2027, up 2% from the revised 2025/2026 estimate of 28.5 million bags. The first half of 2025/2026 saw exports reach 15.7 million bags, a 27.5% increase year-on-year.

Domestic consumption continues to grow, forecast at 5 million bags in 2026/2027, up from 4.9 million bags. GDP grew above 8% in 2025, and tourism reached 21 million international visitors, boosting coffee demand.

According to the Ministry of Agriculture and Environment, Vietnam’s total coffee area has reached approximately 730,000 hectares. Harvested area for 2026/2027 is forecast at 644,000 hectares, up from 630,200 hectares in 2025/2026.

Improved productivity and climate-resilient varieties drive steady Robusta growth, while Arabica area remains stable. Replanted areas under the Coffee Replanting Program (2021-2023) will enter stable harvest phase with high-yield potential.

However, the Western Highland Agriculture and Forestry Science Institute warns that approximately 30% of current coffee area is 20 years or older and requires replanting or renewal to maintain productivity.

Rising Input Costs and Farmer Concerns

High coffee export prices in 2024-2025 created strong production incentives but also risks to long-term sustainability. Farmers increased input applications, often applying fertilizer beyond recommended levels, resulting in excess nitrogen, phosphorus, and potassium in some areas of the Central Highlands.

Early or excessive irrigation may increase coffee yield in the short term, but depletes groundwater and increases production costs over time. Local farmers report that production costs have increased significantly, with fertilizer and fuel rising approximately 30% and labor costs rising 33% compared to the previous year.

Farmers express concern about reduced rainfall and drought conditions in the Central Highlands. Precipitation fell below normal from January to March 2026 in major coffee-producing provinces including Dak Lak, Gia Lai, Kon Tum, Dak Nong, and Lam Dong.

NOAA forecasts a 62% probability that El Niño conditions will emerge during June to August 2026 and persist through at least the end of 2026. El Niño typically brings warmer and drier conditions to parts of Southeast Asia, which could reduce coffee productivity and production.

Sustainability and EUDR Compliance

Vietnam is steadily transforming from a quantity-focused coffee exporter into a globally competitive producer of high-quality, innovative, and sustainable coffee products. As of 2025, approximately 40% of Vietnam’s coffee area has achieved sustainability certification standards such as Rainforest Alliance, Fairtrade, 4C, and UTZ.

The Specialty Coffee Program, developed by MAE in 2021, continues to focus on improving bean quality through better farming practices, selective harvesting, and post-harvest processing techniques. This shift attracts attention from global buyers seeking distinctive flavor profiles and traceable origin stories.

MAE and coffee export companies are actively working to fulfill EU Deforestation Regulation (EUDR) requirements, which take effect in December 2026. However, challenges remain with more than 600,000 smallholder households involved in coffee production.

Intercropping and Crop Diversification

In recent years, many farmers in the Central Highlands converted portions of their coffee-growing areas to higher-value crops like durian, which can generate profits 2.5 to 3 times higher than coffee per unit area. However, the sharp rise in coffee export prices in 2024 reversed this trend, prompting farmers to return to coffee cultivation.

The traditional coffee monoculture model is gradually shifting toward intercropping systems, where farmers grow coffee alongside durian, avocado, macadamia, or pepper. While intercropping helps diversify farmer income, it reduces coffee tree density per unit area, complicating accurate acreage measurements.

Exports and Markets

Vietnam exported approximately 15.7 million bags in the first half of 2025/2026, a 27.5% increase compared to the same period in 2024/2025. Major markets demonstrated strong export growth, including Germany (up 46%), Italy (up 31%), the United States (up 37%), Spain (up 22%), Russia (up 35%), and Japan (up 19%).

Asian markets also recorded significant growth, including India (up 1,022%), Cambodia (up 473%), Thailand (up 56%), and China (up 50%). Soluble and roasted coffee exports account for approximately 13% of total exports, with forecast at 3.55 million bags in 2026/2027.

During the first half of 2025/2026, Laos was Vietnam’s largest coffee supplier, accounting for 45% of total imports, followed by Indonesia (19%), Brazil (16%), and Uganda (10%).

Prices and Stocks

The average export price reached $5,127 per ton in the first half of 2025/2026, down 9% compared to the same period of 2024/2025. In March 2026, the export price was $4,553 per ton, a 22% decrease compared to March 2025. However, coffee prices remain elevated compared to 2023/2024.

Domestic Robusta coffee prices in the Central Highlands averaged approximately VND 102,800 per kg in the first half of 2025/2026, a 16% decrease compared to the first half of 2024/2025.

Ending stocks for 2025/2026 are revised down to 689,000 bags based on stronger exports and higher domestic consumption. Stocks are forecast to continue declining to 489,000 bags in 2026/2027.

Table 1: Vietnam Coffee Production, Supply and Distribution (1,000 60 kg bags)

Item 2024/2025 2025/2026 2026/2027
Beginning Stocks 889 1,089 689
Arabica Production 1,000 1,200 1,100
Robusta Production 28,000 30,500 31,400
Total Production 29,000 31,700 32,500
Total Imports 1,200 1,300 1,250
Total Exports 25,200 28,500 28,950
Domestic Consumption 4,800 4,900 5,000
Ending Stocks 1,089 689 489

Frequently Asked Questions

How much coffee will Vietnam produce in 2026/2027?

Production is forecast at 32.5 million 60 kg bags, including 31.4 million bags of Robusta and 1.1 million bags of Arabica.

What is driving the increase in production?

Expansion in harvested area, replanting programs, and high price incentives from 2024-2025 peaks.

What are the main export destinations for Vietnamese coffee?

Major markets include Germany, Italy, the United States, Spain, Russia, Japan, and emerging Asian markets like India, Thailand, and China.

How are prices trending?

Export prices have declined 9% from the same period last year, and domestic Robusta prices are down 16%.

What is the El Niño risk for Vietnam’s coffee crop?

NOAA forecasts a 62% probability of El Niño emerging by mid-2026, which could bring drier conditions to the Central Highlands and reduce productivity.

How much of Vietnam’s coffee area is certified sustainable?

Approximately 40% of Vietnam’s coffee area has achieved sustainability certifications such as Rainforest Alliance, Fairtrade, 4C, and UTZ.


Author: Qahwa World – Ho Chi Minh City | Source: USDA Foreign Agricultural Service – Report VM2026-0016 | Date: May 20, 2026
Black Coffee Twig Borer: A Growing Threat to Robusta and Arabica

Author: Qahwa World – Agricultural Desk
Source: International Coffee Pest Monitor, USDA, and industry research (2025-2026)
Date: May 22, 2026In this article, we discuss Black Coffee Twig Borer pest control solutions and strategies for the coming seasons.

Executive Summary

  • The Black Coffee Twig Borer (Xylosandrus compactus) is an invasive ambrosia beetle native to Southeast Asia, now damaging coffee in East Africa, Hawaii, and Latin America.
  • It primarily attacks Robusta but also infests Arabica and over 200 host plants. Yield losses can reach 20-50% in severe infestations.
  • Female beetles bore into small twigs, introduce ambrosia fungi, and cause branch dieback within 5-14 days.
  • Factors favoring infestation: high planting density, poor pruning, water stress, and unsuitable shade trees (e.g., Maesopsis eminii).
  • Integrated Pest Management (IPM) combines sanitation pruning, ethanol‑baited bottle traps, and maintaining tree health. Chemical control is a last resort.
  • In Uganda, annual losses are estimated in tens of millions of dollars. Community‑wide trapping and pruning are the most effective.
  • For growers in arid regions like the Gulf, prevention through certified pest‑free material and rigorous scouting is critical.

The Black Coffee Twig Borer (Xylosandrus compactus), also known as the shot‑hole borer, is a small ambrosia beetle native to Southeast Asia. It has become a significant invasive pest in many coffee‑growing regions, including East Africa (especially Uganda), Hawaii, parts of Latin America, and Southeast Asia.

It primarily affects Robusta coffee (Coffea canephora) but also attacks Arabica and over 200 other host plant species across 62 families. The beetle is considered one of the most economically damaging pests in affected areas, with reported losses reaching up to 20‑50% in severe infestations through branch dieback and reduced yields.

Biology and Life Cycle

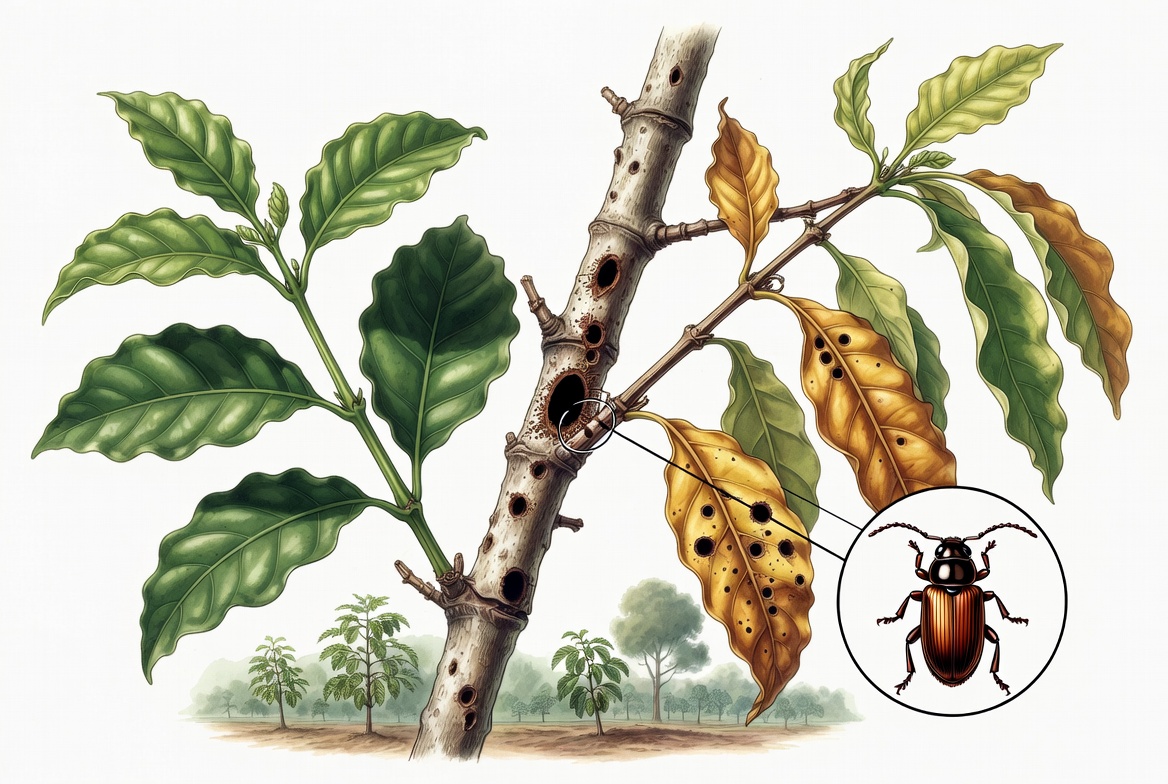
Adult females are 1.4–1.7 mm long, dark brown to black and shiny. Males are smaller (0.9–1.3 mm), flightless, and rarely seen outside galleries.

Only females initiate attacks. They bore into small twigs and branches (usually less than 2 cm in diameter) and introduce symbiotic ambrosia fungi (Raffaelea spp. or similar) that grow inside the tunnels and serve as food for adults and larvae.

The full life cycle takes about 3–5 weeks depending on temperature. Females mate inside the gallery (or via parthenogenesis) and lay eggs. Larvae feed on the fungus. New females emerge to attack other branches.

The pest attacks stressed, weakened, or overcrowded plants more aggressively, especially during dry seasons. However, it can also infest apparently healthy trees.

Symptoms and Damage on Coffee Trees

External signs include tiny circular entry holes (about 1 mm) on twigs, often with frass (sawdust‑like material) or sap oozing. Sudden wilting and yellowing of leaves on affected branches (flagging) appears within days. Dieback of twigs and small branches occurs within 5–14 days.

Internal damage involves fungal growth that blocks the xylem (water‑conducting tissues), causing rapid desiccation. Infested branches often show dark staining inside.

Economic impact is severe: loss of fruit‑bearing branches reduces yield directly. Repeated attacks weaken trees, increase susceptibility to other diseases, and can kill young plants or seedlings. In Uganda, annual losses have been estimated in tens of millions of US dollars. In other regions, branch loss can reach 20–40%.

Factors Favoring Infestation

High planting density and poor pruning (bushy canopies) create favorable conditions. Excessive or unsuitable shade trees, such as Maesopsis eminii (musizi) and Markhamia platycalyx (musambya), also increase risk. Water stress during dry periods, poor soil nutrition, and low tree vigor are additional factors. The presence of alternate hosts nearby further exacerbates the problem.

Integrated Pest Management (IPM) – Current Best Practices (2025-2026)

The most effective and sustainable approach combines cultural, mechanical, and monitoring methods. Chemical use is generally discouraged as a primary strategy.

Cultural practices form the foundation of control. Sanitation pruning is highly effective: regularly inspect and prune infested twigs or branches, then immediately burn or bury them deeply to prevent re‑infestation. However, it is labor‑intensive.

Tree health management is critical: ensure optimal fertilization, irrigation during dry spells, proper spacing (e.g., 3 m x 3 m), and balanced shade. Healthy, vigorous trees are far less susceptible.

Shade management involves using suitable shade trees (e.g., papaya may reduce infestation) and avoiding known host shade trees. Older, taller shade systems often show lower infestation levels. Remove or avoid planting nearby susceptible species.

Monitoring and mass trapping are highly recommended. Ethanol‑baited bottle traps are low‑cost and effective. Use empty plastic bottles with soapy water plus ethanol (or local alcohol like waragi at ~75% concentration) as attractant. Place 7–15 traps per acre, preferably in the lower canopy. Community‑wide trapping is most successful.

Chemical control should be a last resort. Systemic insecticides like imidacloprid (e.g., after pruning) have shown efficacy in some studies, but resistance risks and negative effects on beneficial insects limit long‑term use.

Emerging approaches include push‑pull strategies using repellents (e.g., verbenone + methyl salicylate) combined with attractant traps (2024 studies). Biological enhancement through biodiversity and natural enemies is also being explored.

Recommendations for Farmers (Particularly in UAE/Gulf Region)

Although Xylosandrus compactus is not yet widely reported in the UAE, vigilance is important if importing coffee plants or growing in similar climates. Source certified, pest‑free planting material. Maintain excellent tree nutrition and irrigation (critical in arid conditions).

Implement routine scouting, especially in dry or hot seasons. Adopt area‑wide management by coordinating with neighboring farms. Combine pruning, sanitation, and mass trapping as the core strategy.

Key principle: prevention through plant health is more effective and economical than curative measures.

Frequently Asked Questions

What is the Black Coffee Twig Borer?
It is an invasive ambrosia beetle (Xylosandrus compactus) that attacks coffee twigs, causing branch dieback and yield losses of 20-50%.

Which coffee varieties are most affected?
Robusta is the primary host, but Arabica and over 200 other plant species are also attacked.

How can I identify an infestation?
Look for tiny entry holes (1 mm) on twigs, sawdust‑like frass, sudden wilting of branches (flagging), and dieback within 5-14 days.

What is the most effective control method?
Sanitation pruning (removing and destroying infested branches) combined with ethanol‑baited bottle traps and maintaining tree health.

Are chemical insecticides recommended?
Only as a last resort. Imidacloprid has some efficacy, but resistance and environmental risks limit its use.

Can I use traps for mass trapping?
Yes. Ethanol‑baited bottle traps are low‑cost, simple to make, and highly effective when used community‑wide (7‑15 traps per acre).


Author: Qahwa World – Agricultural Desk | Source: International Coffee Pest Monitor, USDA, and industry research (2025-2026) | Date: May 22, 2026

Ugandan Coffee Output Rises Slightly to 7.2 Million Bags in 2026

Author: Qahwa World – Nairobi
Source: USDA Foreign Agricultural Service – Report UG2026-0001
Date: May 20, 2026

Ugandan Coffee Output Rises to 7.2 Million Bags in 2026

Executive Summary

  • Ugandan coffee production for 2026/2027 is forecast at 7.2 million 60 kg bags, up from 7.1 million bags.
  • Planted area expands to 595,000 hectares, driven by land use shift from timber to coffee in Masaka region.
  • Robusta accounts for 80% of output (6.0 million bags); Arabica 20% (1.1 million bags).
  • Exports forecast at 6.8 million bags, up 1.9%, with the European Union taking 73% of total exports.
  • Domestic consumption rises slightly to 335,000 bags, supported by hospitality sector growth.
  • Fertilizer prices up 21% for a 50‑kg bag, limiting farmer uptake.
  • Government plans gradual shift from green bean exports to processed coffee (roasted and soluble) to boost value addition.

The USDA Foreign Agricultural Service office in Nairobi forecasts Ugandan coffee production for marketing year 2026/2027 at 7.2 million 60 kg bags, up from 7.1 million bags in the previous season.

The increase is driven by expansion in area under production, supported by sustained high prices in recent years.

Coffee exports in 2026/2027 are projected to rise from 6.7 million to 6.8 million bags.

Domestic consumption is forecast to increase slightly to 335,000 bags, supported by growth in the hospitality sector and a gradual rise in coffee consumption, particularly in urban areas.

FAS Nairobi forecasts planted area in 2026/2027 at 595,000 hectares, up from 590,000 hectares in 2025/2026.

This growth is driven by a gradual shift in land use from timber production to coffee, particularly in the Masaka region.

Uganda’s smallholder coffee farmers typically farm on 0.5 to 2.5 hectares of land.

Small farms dominate the sector and account for about 90% of total production, while medium and large-scale estates contribute the remaining 10%.

Robusta Dominates Production

For 2026/2027, post forecasts robusta production at 6.0 million 60 kg bags and arabica production at 1.1 million bags.

The increase reflects marginal expansion in area planted, driven by prevailing high prices.

Favorable weather conditions, increased adoption of improved agronomic practices, and the maturation of high-yielding trees planted earlier further support growth.

Robusta accounts for approximately 80% of total national production, with arabica making up the remaining 20%.

Uganda’s main coffee-growing regions are the central, eastern, and western zones, with emerging production areas in the north.

Robusta is mainly grown in the central region, although cultivation is increasingly expanding into the north due to increased investment and land availability.

Arabica is mainly cultivated in high-altitude areas of the eastern and western regions.

Table 1: Uganda Coffee Production, Supply and Distribution (1,000 60 kg bags)

Item 2024/2025 2025/2026 2026/2027
Planted Area (1,000 HA) 580 590 595
Harvested Area (1,000 HA) 570 575 580
Robusta (1,000 bags) 5,670 5,815 6,025
Arabica (1,000 bags) 1,030 1,060 1,135
Total Production (1,000 bags) 6,700 6,875 7,160
Exports (1,000 bags) 6,350 6,700 6,830
Domestic Consumption (1,000 bags) 325 330 335
Ending Stocks (1,000 bags) 269 334 329

Fertilizer Costs and Pest Challenges

Fertilizer use among Ugandan coffee farmers remains low, although farmers are starting to adopt its use.

Medium and large-scale farmers account for most fertilizer applications, while a growing number of smallholders are beginning to incorporate fertilizer into their agronomic practices.

However, high costs continue to constrain broader uptake.

Prices of commonly used nitrogen and phosphorus-based fertilizers have increased by approximately 21% for a 50‑kilogram bag, limiting affordability for farmers.

Most smallholder farmers continue to rely primarily on mechanical and traditional control methods to manage pests and diseases.

However, there is a gradual increase in the use of agrochemicals, particularly pesticides, driven by persistent and increasingly severe pest and disease pressures.

The twig borer is the most common pest, while coffee rust is the most recurrent disease.

These challenges continue to affect yields and increase production costs.

Coffee production is largely rain-fed, with rainfall generally sufficient.

Irrigation is more relevant in areas with less reliable rainfall, including parts of the north and east, but adoption remains limited due to high capital and operational costs.

Exports and Markets

Uganda exports over 98% of its coffee as green beans.

Exports in 2026/2027 are forecast at approximately 6.8 million bags, up 1.9%, driven by sustained strong global demand.

The European Union remains Uganda’s main export destination, accounting for about 73% of total exports in 2024/2025.

Morocco and the United States each account for about 6%.

The United Kingdom, Switzerland, Australia, Turkey, and Ukraine each take about 1%, while other destinations collectively account for about 6%.

Uganda is increasingly expanding its reach into non-traditional markets, with Morocco and China gaining importance.

Post revised the 2025/2026 export estimate upward by 2.8% from 6.52 to 6.70 million bags to reflect additional exports to non-reporting destinations, particularly Sudan.

Policy Shift Toward Value Addition

Uganda plans to gradually reduce exports of unprocessed coffee in line with the country’s focus on value addition to achieve its ambitious tenfold growth strategy.

The government aims to attract investment in coffee processing activities to expand industries, increase export earnings, and create jobs across the value chain.

This would prioritize exports of processed coffee products such as roasted and soluble coffee over green beans.

However, officials indicate that the transition will occur gradually rather than through an immediate ban, allowing green bean exports to continue in the short to medium term as local processing capacity and supporting infrastructure expand.

In 2025, the government restructured the Uganda Coffee Development Authority, integrating its functions into the Ministry of Agriculture, Animal Industry and Fisheries.

Initial implementation has yielded mixed feedback, with some stakeholders reporting continued access to services with minimal disruption, while others indicate delays in service delivery.

Frequently Asked Questions

How much coffee will Uganda produce in 2026/2027?
Production is forecast at 7.2 million 60 kg bags, up from 7.1 million bags.

What is the breakdown between Robusta and Arabica?
Robusta accounts for 6.0 million bags (80%), while Arabica accounts for 1.1 million bags (20%).

What are the main export destinations for Ugandan coffee?
The European Union takes 73% of exports, followed by Morocco (6%) and the United States (6%).

How much have fertilizer prices increased?
Fertilizer prices have risen by approximately 21% for a 50‑kg bag.

What is Uganda’s policy on coffee exports?
Uganda plans to gradually reduce green bean exports and shift toward processed coffee (roasted and soluble) to boost value addition.


Author: Qahwa World – Nairobi | Source: USDA Foreign Agricultural Service – Report UG2026-0001 | Date: May 20, 2026

Peruvian Coffee Output Stable at 4.78 Million Bags in 2026

Author: Qahwa World – Lima
Source: USDA Foreign Agricultural Service – Report PE2026-0008
Date: May 20, 2026

Peruvian Coffee Output Stable at 4.78 Million Bags in 2026

Executive Summary

  • Peruvian coffee production for 2026/2027 is estimated at 4.78 million 60 kg bags, broadly unchanged from the previous year.
  • Harvested area is estimated at 340,000 hectares, up about 1% from last season.
  • Exports are estimated at 4.55 million bags, also unchanged, supported by stable supply and strong demand for high-quality Arabica.
  • The United States is the largest market for Peruvian coffee with a 32% share, followed by Germany (16%) and Belgium (11%).
  • Over 90% of coffee is grown by smallholders on plots smaller than 5 hectares.
  • Peru is the world’s largest exporter of organic coffee, with approximately 90,000 certified hectares.
  • Domestic consumption is estimated at 305,000 bags, with 75% being soluble coffee.

The USDA Foreign Agricultural Service office in Lima estimates Peruvian coffee production for marketing year 2026/2027 at 4.78 million 60 kg bags, broadly unchanged from 2025/2026 (4.76 million bags). Total exports are estimated at 4.55 million bags, also broadly unchanged, supported by stable supply and continued demand for high-quality Arabica and certified coffees. Domestic consumption is estimated at 305,000 bags.

Harvested area is estimated at 340,000 hectares in 2026/2027, up about one percent from 2025/2026. The number of bearing trees is estimated at 630 million, while total tree population is estimated at 668 million trees. Arabica is the dominant coffee type, primarily of the Typica and Caturra varieties. Most farms are small (under 5 hectares) and rely on traditional methods like shade-growing, hand-picking, and sun-drying.

Credit Access and Infrastructure Challenges

Limited access to credit remains a major challenge for small producers. Private banks often reject untitled land as collateral, forcing farmers to rely on informal lenders or buyers. This results in burdensome fixed-price contracts and high interest rates.

Many farmers join cooperatives to obtain better prices, technical support, and marketing resources. However, infrastructure challenges, particularly poor roads and inadequate storage facilities, continue to limit Peru’s competitiveness in global coffee markets.

Table 1: Peru Coffee Production, Supply and Distribution (1,000 60 kg bags)

Item 2024/2025 2025/2026 2026/2027
Planted Area (1,000 HA) 370 370 375
Harvested Area (1,000 HA) 332 335 340
Arabica Production (1,000 bags) 3,700 4,200 4,780
Robusta Production (1,000 bags) 0 0 0
Total Production (1,000 bags) 3,700 4,764 4,780
Total Exports (1,000 bags) 3,440 4,238 4,550
Domestic Consumption (1,000 bags) 220 300 305
Ending Stocks (1,000 bags) 28 26 21

Production, Yields and Risks

Based on estimated production and harvested area, average yields in 2026/2027 are implied at approximately 843 kilograms per hectare. Yields vary significantly, with well-managed plantations achieving up to 45 bags (2,700 kg) per hectare.

Labor has the highest production cost, accounting for about 58% of total expenses, followed by fertilizers (24%) and agrochemicals (12%).

Peru’s coffee sector faces several risks that could affect production and export performance in 2026/2027:

  • Climate variability: Irregular rainfall, higher temperatures, and extreme weather events affect flowering, yields, and quality.
  • EUDR compliance: Meeting the EU Deforestation Regulation requirements remains a major challenge, especially for smallholders lacking land titles and georeferenced data.
  • Labor constraints: Rising labor costs and shortages during peak harvest periods increase production costs.

Exports and Key Markets

Peruvian coffee exports in 2026/2027 are estimated at 4.55 million bags, nearly unchanged from 2025/2026. Bean exports account for most shipments at 4.25 million bags, while roasted and ground exports are estimated at 300,000 bags and soluble exports at 4,000 bags.

The United States remained the top destination in 2024/2025, receiving 32% of exports, followed by Germany (16%) and Belgium (11%).

Export prices rose sharply in 2025/2026, averaging $7,577 per ton, 55% above the previous year. Prices are expected to remain above historical averages due to continued supply uncertainty, higher production costs, and sustained demand for high-quality Arabica.

Peru is the world’s leading exporter of organic coffee, with approximately 90,000 hectares certified organic. Many additional hectares are effectively organic due to limited use of chemical inputs. To meet foreign demand for specialty coffee, many producers pursue certification programs including Fair Trade, Organic, Rainforest Alliance, and Starbucks C.A.F.E. Practices.

Domestic Consumption and Policies

Domestic coffee consumption in 2026/2027 is estimated at 305,000 bags, up about two percent from 2025/2026. Soluble coffee accounts for 75% of total domestic consumption. However, consumption patterns are evolving, with a growing preference for roasted and ground coffee, especially among young urban consumers. Despite these trends, domestic consumption still represents only about six percent of total production.

Through the Food for Progress Program, FAS financed the regional MOCCA project to strengthen coffee value chains. In Peru, MOCCA has trained over 27,000 producers, supported the establishment of 515 nurseries, and facilitated nearly $17 million in credit.

Peruvian coffee producers have expressed concerns over the EU Deforestation Regulation (EUDR), which requires that products not originate from land deforested after December 31, 2020. The National Coffee Board warns that small producers may struggle to comply due to lack of land use certifications and titles. Although Congress amended the forestry law in January 2024 to simplify certification, producers assert that more support is needed.

Peru’s coffee sector provides 855,000 jobs, primarily in remote and economically vulnerable regions. The government promotes coffee cultivation as a legal alternative to coca leaf production through the National Commission for Development and Life Without Drugs (DEVIDA).

Frequently Asked Questions

How much coffee will Peru produce in 2026/2027?

Production is estimated at 4.78 million 60 kg bags, broadly unchanged from the previous year.

What are the main export destinations for Peruvian coffee?

The United States is the largest market with 32% share, followed by Germany (16%) and Belgium (11%).

What is Peru’s position in the organic coffee market?

Peru is the world’s largest exporter of organic coffee, with approximately 90,000 certified hectares.

What percentage of Peruvian coffee is grown by smallholders?

Over 90% of coffee is grown by smallholders on plots smaller than 5 hectares.

How much coffee does Peru consume domestically?

Domestic consumption is estimated at 305,000 bags, with 75% being soluble coffee.


Author: Qahwa World – Lima | Source: USDA Foreign Agricultural Service – Report PE2026-0008 | Date: May 20, 2026

Ethiopian Coffee Output Rises 4.7% in 2026

Author: Qahwa World – Addis Ababa

Source: USDA Foreign Agricultural Service – Report ET2026-0005
Date: May 20, 2026

Executive Summary

  • Ethiopian coffee production for marketing year 2026/2027 is forecast at 12.10 million 60 kg bags, up 4.7%.
  • Harvested area is forecast at 800,000 hectares, a 1.3% increase from the previous year.
  • Exports are forecast at 7.13 million bags, up 2.4%, supported by growing demand for Ethiopian Arabica.
  • China emerged as the third largest market in 2024/2025, with exports surging 264% to 670,000 bags.
  • Red cherry prices hit record highs of 220‑250 Birr per kg in Yirgacheffe, nearly four times the previous season.
  • About 5.9 million farmers are engaged in coffee production; smallholders account for 90% of national output.
  • The government allocated 100,000 hectares for private mechanized coffee farms to transform the sector.

The USDA Foreign Agricultural Service office in Addis Ababa forecasts Ethiopian coffee production for marketing year 2026/2027 at 12.10 million 60 kg bags, a 4.7% increase from the previous season. T

he growth is driven by improved yields under normal weather conditions. Harvested area is forecast at 800,000 hectares, up 1.3% from the estimated area for 2025/2026.

Exports are forecast at 7.13 million bags, supported by growing demand for Ethiopian Arabica beans. Marketing year 2025/2026 constitutes an exceptional period for Ethiopia’s coffee export sector, as record high fresh cherry prices and rising operating costs continue to place significant financial pressure on traders and exporters. China is rapidly emerging as one of the top coffee buyers, driven by its tariff free market access.

Production Gains Supported by Improved Yields and Area Expansion

The forecast assumes favorable weather conditions, particularly regular rainfall. In April 2026, farmers reported healthier flowering and more uniform cherry development across key producing regions. The southern regions are expected to experience a positive year after reporting a reduced harvest during the 2025/2026 season. The Ethiopian Coffee and Tea Authority reports that 5.9 million farmers are engaged in coffee production across the country. Smallholder farmers dominate Ethiopia’s coffee sector, accounting for 90% of total national production. These farmers typically cultivate coffee on small plots averaging less than half a hectare, often integrating coffee trees into mixed farming systems alongside food crops.

At the farm level, growing adoption of improved agronomic practices such as pruning and stumping of aging trees, along with increased use of recommended extension packages including composting and soil management techniques, is supporting productivity gains. Farmers are also becoming more aware of the benefits of stumping old coffee trees and intercropping. The gradual uptake of improved seedlings that are both higher yielding and more disease resistant is beginning to contribute to enhanced productivity.

Table 1: Ethiopia Coffee Production Estimate and Forecast

Marketing Year 2024/2025 (Estimate) 2025/2026 (Estimate) 2026/2027 (Forecast)
Area Harvested (hectares) 760,000 790,000 800,000
Production (million bags) 11.46 11.56 12.10
Yield (MT/ha) 0.90 0.90 0.91

National Stumping Campaign Boosts Yields

According to industry sources, nearly 70% of Ethiopia’s coffee trees are old, with some estimated to be more than 100 years old. Following the launch of a national stumping campaign four years ago, the Ethiopian Coffee and Tea Authority reports that stumped trees have already begun producing yields. Stumped trees cover 15% of the total coffee harvested area in 2025/2026. The Oromia region recorded the highest stumping rate at 19% of total harvested area, followed by South Ethiopia region at 14% and Sidama at 13%. Studies in Sidama and South Ethiopia regions have demonstrated that stumped coffee trees can increase yields by up to threefold within four years after stumping.

The Ethiopian Agricultural Research Institute reports that over 50 improved varieties offering higher yields and stronger disease resistance have been distributed to coffee growers across the country. These improved hybrid varieties yield around 2.8 tons per hectare under better management conditions, compared with current national average yields of less than 1.0 ton per hectare.

Ethiopia Pushes for Mechanized and Commercial Farms

The Government of Ethiopia is interested in large scale modern coffee production and has allocated 100,000 hectares of land for private sector coffee development. This marks the first time the government has allocated large tracts of land exclusively for modern coffee production. This represents a 70% increase compared to the country’s current 143,000 hectares of commercial coffee farms. Local officials describe the initiative as a strategic national project designed to transform Ethiopia’s coffee sector from its current reliance on traditional smallholder farming into a hybrid model that combines established practices with large scale technology driven production. Reports from May 2026 show that 110 private investors received new farmland for coffee cultivation. Planting has not yet begun, and authorities are urging investors to start developing the farmlands quickly.

Record Cherry Prices and Tightening Washed Coffee Supply

Farmers anticipated that the previous year’s record high coffee prices would maintain momentum, driving local cherry prices to unprecedented levels. At the start of 2025/2026, cherry prices tripled in some areas and quadrupled in others compared to the previous season. Several farmer cooperatives in Yirgacheffe district reported that red cherry prices peaked at 220‑250 Birr ($1.42‑$1.62) per kilogram in December 2025, nearly four times higher than the previous season. This sharp price hike, combined with rising production costs including labor expenses, created significant challenges for wet mills.

As a result, a notable shift in coffee processing practices occurred. Several farmers opted to process coffee at home rather than sell red cherries to washing stations, capturing higher returns by drying and selling natural coffee themselves. Simultaneously, wet mills became less inclined to purchase fresh cherries due to price increases and elevated working capital requirements. Farmers retaining cherries and wet mills reducing purchases significantly decreased the volume of red cherries reaching washing stations, leading to tighter availability of washed coffee during 2025/2026, alongside a growing share of natural processed coffee beans.

China Emerges as Third Largest Market

In 2024/2025, Ethiopia exported around 670,000 bags to China, generating more than $274 million in revenue. This positioned China as the third largest destination for Ethiopian coffee, a sharp rise from a decade ago when China ranked 17th with exports of approximately 22,000 bags. The pace of this growth highlights how quickly China has moved from a marginal buyer to a major player. Chinese imports have been driven by targeted trade promotion, improved market access, and strengthening commercial linkages. Since December 1, 2024, Ethiopian exports to China have enjoyed tariff free access, and China expanded its zero tariff policy to cover all tariff lines for products from 53 African countries effective May 1, 2026.

According to a USDA report, China’s domestic coffee market was estimated at approximately $42 billion in 2024, as coffee consumption rises rapidly among younger urban consumers. China’s coffee consumption reached 6.3 million bags by the end of 2024, but per capita consumption remains low at 22 cups annually, indicating substantial room for future expansion. Large chains such as Luckin Coffee (over 26,000 stores) and Cotti Coffee (around 15,000 outlets) continue to scale aggressively, shaping consumer habits and fueling demand for high quality beans.

Table 2: Top 10 Export Destinations for Ethiopian Coffee (MY 2024/2025)

Rank Country Volume (1,000 bags) Share
1 Saudi Arabia 1,182 15.9%
2 Germany 1,126 15.2%
3 China 670 9.0%
4 Belgium 651 8.8%
5 United States 614 8.3%
6 UAE 444 6.0%
7 South Korea 381 5.1%
8 Italy 259 3.5%
9 Russia 171 2.3%
10 Sudan 117 1.6%

Domestic Consumption Expands Despite High Prices

Domestic coffee consumption for 2026/2027 is forecast at 5.0 million bags. Post revised the 2025/2026 domestic consumption estimate upward from 3.70 million bags to 4.50 million bags, reflecting current market dynamics where falling global coffee prices are anticipated to redirect more supply domestically. Burgeoning demand in both rural and urban centers, as well as the increasingly emerging coffee culture among youth, is driving domestic consumption. Ethiopia ranks among the largest coffee consuming countries globally within the group of major producers. Per capita consumption is estimated at around 2.0 kilograms per year.

EUDR Compliance and Organic Certification Challenges

Ethiopia is making progress toward compliance with the EU Deforestation Regulation, which takes effect on December 30, 2026 for large businesses and June 30, 2027 for smaller enterprises. The Ethiopian Coffee and Tea Authority is working with international development partners and private sector stakeholders to operationalize a national traceability platform. Hundreds of thousands of smallholder plots have already been mapped and registered. However, challenges remain due to Ethiopia’s fragmented smallholder production system, limited digital infrastructure, and remoteness of many producing areas.

The EU’s updated organic regulation (Regulation 2018/848) became fully binding for non EU exporters on January 1, 2025, ending the previous equivalence system. The minimum annual on site inspection sampling rate has risen from approximately 2% to 5% of farmers, while at least 2% must now undergo residue sampling. The regulation also caps group certifications at roughly 2,000 smallholders and mandates annual audits for all certified operators. These stricter requirements are causing longer field inspection times, rising compliance costs, and increasing administrative burdens, making EU organic certification increasingly difficult for Ethiopian smallholder coffee farmers to maintain.

Frequently Asked Questions

How much coffee will Ethiopia produce in 2026/2027?

Production is forecast at 12.10 million 60 kg bags, a 4.7% increase from the previous year.

How many farmers are engaged in coffee production in Ethiopia?

About 5.9 million farmers, with smallholders accounting for 90% of national output.

What are the main export destinations for Ethiopian coffee?

Saudi Arabia and Germany are the largest with 15.9% and 15.2% shares, followed by China, Belgium, and the United States.

How much coffee did Ethiopia export to China in 2024/2025?

Around 670,000 bags worth $274 million, a 264% increase from the previous year, making China the third largest market.

Why are red cherry prices so high in 2025/2026?

Farmers anticipated continued momentum from record prices the previous year, driving local cherry prices to unprecedented levels, reaching 220‑250 Birr per kg in Yirgacheffe.

How is Ethiopia preparing for the EU Deforestation Regulation?

The Ethiopian Coffee and Tea Authority is developing a national traceability platform with international partners; hundreds of thousands of smallholder plots have already been mapped and registered.


Author: Qahwa World – Addis Ababa | Source: USDA Foreign Agricultural Service – Report ET2026-0005 | Date: May 20, 2026

El Niño: What It Is and How It Affects Coffee

Author: Qahwa World – Climate Desk

Source: NOAA, WMO, ICO, StoneX, industry sources
Date: May 22, 2026

Executive Summary

  • There is a 96% probability that El Niño will persist through the Northern Hemisphere winter of 2026‑2027.
  • Sea surface temperatures in the Niño 3.4 region have already exceeded the +0.5°C El Niño threshold.
  • Vietnam and Indonesia face drought and higher temperatures, threatening Robusta yields.
  • Brazil may see irregular rainfall during critical flowering (August‑October 2026), reducing Arabica quality.
  • Colombia and Central America face mixed risks: excess rain (leaf rust) or drought.
  • Analysts expect higher coffee price volatility in 2027, with Robusta supply risks pushing futures higher.
  • Smallholder farmers in vulnerable regions could face income losses, food insecurity, and migration pressure.

As of mid‑May 2026, the tropical Pacific is showing unmistakable signs of a rapid transition toward El Niño conditions.

According to the NOAA Climate Prediction Center’s ENSO Diagnostic Discussion released on May 14, there is an 82% probability that El Niño will emerge between May and July 2026, rising to a 96% chance that it will persist through the Northern Hemisphere winter of 2026‑2027.

Scientists are closely monitoring whether this event could evolve into a Super El Niño, potentially rivaling the record‑strength episodes of 1982‑83, 1997‑98, or 2015‑16. With sea surface temperatures in key Niño regions already warming sharply, the stage is set for significant disruptions to global weather patterns — from devastating floods in South America to severe droughts across Southeast Asia and parts of East Africa.

What Is El Niño?

El Niño (Spanish for “The Little Boy” or “Christ Child”) is the warm phase of the El Niño‑Southern Oscillation (ENSO), Earth’s most influential climate variability pattern. Under normal conditions, strong easterly trade winds push warm surface water westward across the equatorial Pacific toward Indonesia, allowing cold, nutrient‑rich water to upwell off the coasts of Peru and Ecuador. During El Niño, these trade winds weaken or reverse. Warm water spreads eastward, suppressing upwelling and altering atmospheric circulation patterns worldwide.

The counterpart, La Niña, brings cooler waters and opposite weather effects. ENSO events typically occur every 2‑7 years and last 9‑18 months.

Current Status – May 2026

The equatorial Pacific is currently in a transitional state following a weak La Niña. Sea surface temperatures in the Niño 3.4 region have risen rapidly, with recent weekly values exceeding the +0.5°C El Niño threshold.

Multiple international models, including those from NOAA, the ECMWF, and the WMO, show high confidence in El Niño development by mid‑to‑late 2026. While peak strength remains uncertain, some projections suggest anomalies could exceed +2.0°C, raising the possibility of a strong‑to‑very‑strong event.

Global Weather Impacts

El Niño redistributes heat and moisture across the planet:

  • South America (Peru, Ecuador, northern Brazil): Increased rainfall and flooding risks, potential damage to infrastructure and agriculture.
  • Southeast Asia, Indonesia, Australia: Significantly reduced rainfall, drought, higher wildfire risk, water shortages.
  • East Africa: Wetter‑than‑average conditions, increased flood and disease risks.
  • Southern United States: Wetter winters; Northern US and Canada often milder.
  • Global: Elevated average temperatures (El Niño typically adds ~0.1–0.3°C to global surface temperatures).

Impact on Global Coffee Production

Coffee is one of the most climate‑sensitive major commodities. With roughly 12.5 million farming families dependent on it worldwide, any major ENSO event sends ripples through prices, quality, and livelihoods. The 2026‑2027 El Niño is expected to affect both Arabica and Robusta differently across key origins.

1. Brazil – The World’s Largest Producer

Brazil faces a complex outlook. While the current 2026/27 harvest is projected to be strong, El Niño could disrupt the critical flowering period (August‑October 2026) through irregular rainfall or excessive heat. Historical patterns show El Niño often brings drier conditions to key Arabica regions in Minas Gerais and São Paulo, potentially reducing bean size, increasing defects, and lowering quality.

2. Vietnam and Indonesia – Robusta Heartlands

These two giants are highly vulnerable to El Niño‑induced drought and elevated temperatures. Reduced rainfall and prolonged dry seasons can stress Robusta trees, leading to smaller beans, lower yields, and higher production costs due to increased irrigation needs. The 2015‑16 El Niño caused notable declines in Robusta output in these regions.

3. Colombia, Central America, and East Africa

Colombia and Central America face mixed signals: potential for excessive rainfall in some areas (increasing fungal diseases like coffee leaf rust) or drought in others. Ethiopia and Kenya may see wetter conditions that boost yields in some highlands but heighten disease pressure and complicate harvesting.

Overall Market Outlook

Analysts anticipate higher price volatility in 2027 as the event peaks. While Brazil’s large crop may buffer total volume in the short term, quality concerns and Robusta supply risks could push Arabica and Robusta futures higher. The ICO and major traders are already factoring these risks into their forecasts.

Broader Economic and Humanitarian Implications

  • Price Spikes: Coffee futures have already shown sensitivity to El Niño headlines, with short covering observed.
  • Smallholder Farmers: Millions in vulnerable regions face income losses, food insecurity, and potential migration pressures.
  • Supply Chain: Roasters, traders, and consuming countries should prepare for tighter specialty‑grade supplies and elevated costs.
  • Compounding Factors: Persistent low stocks, high input costs (fertilizers, labor), and climate change amplify risks.

Recommendations and Preparedness

For Governments and International Organizations: Strengthen early warning systems, support farmers with drought‑resistant varieties, irrigation, shade management, and crop insurance. The WMO, FAO, and ICO should coordinate contingency planning.

For the Coffee Industry: Diversify sourcing strategies, invest in sustainable practices that build resilience, and monitor ENSO updates monthly.

For Consumers: Expect potential price increases in premium and everyday coffee blends throughout 2027. Supporting traceable, climate‑smart coffee can help mitigate long‑term risks.

Frequently Asked Questions

What is the probability that El Niño will persist through winter 2026/2027?

NOAA estimates a 96% probability that El Niño will persist through the Northern Hemisphere winter of 2026‑2027.

Which coffee origins are most at risk from this El Niño?

Vietnam and Indonesia (Robusta) face drought; Brazil (Arabica) may see irregular flowering; Colombia and Central America face mixed flood/drought risks.

How could El Niño affect coffee prices?

Analysts expect higher price volatility in 2027. Robusta supply risks could push futures higher, and specialty‑grade supplies may tighten.

What can smallholder farmers do to prepare?

Governments and organizations should provide drought‑resistant varieties, irrigation support, shade management, and crop insurance.

How does this El Niño compare to past events?

Models suggest it could become a strong‑to‑very‑strong event, potentially rivaling 1982‑83, 1997‑98, or 2015‑16, but final strength remains uncertain.

What are the broader economic risks beyond coffee?

Smallholder farmers face income losses and food insecurity; supply chains face tighter supplies and elevated costs; migration pressures may increase.


Author: Qahwa World – Climate Desk | Source: NOAA, WMO, ICO, StoneX, industry sources | Date: May 22, 2026

Coffee Prices Fall on Improved Brazil Crop Prospects

Author: Qahwa World
Source: Barchart
Date: May 20, 2026
Executive Summary:

  • July arabica coffee closed down 0.68% on Wednesday, while July robusta fell 0.51% to a one month low.
  • Arabica hit a one and a half year low on Tuesday amid an improved global supply outlook.
  • The Coffee Trading Academy projects Brazil’s 2026/27 harvest will increase 12% year on year to 71.4 million bags.
  • Marex Group and StoneX both forecast record Brazilian crops above 75 million bags for 2026/27.
  • StoneX projects the 2026 global coffee surplus will expand to 10 million bags, the largest in six years.
  • Vietnam coffee exports rose 15.8% in the first four months of 2026, reaching 810,000 metric tons.
  • ICE robusta inventories hit a two year low last Friday but recovered slightly on Wednesday.

Coffee prices settled lower on Wednesday, May 20, 2026, with robusta falling to a one month low. Expectations of a larger Brazilian coffee crop continue to weigh on prices. July arabica coffee futures closed down 0.68%, and July ICE robusta coffee closed down 0.51%.

Prices have ratcheted lower over the past month, with arabica falling to a one and a half year near term low on Tuesday amid an improved global supply outlook. On May 7, the Coffee Trading Academy projected Brazil’s 2026/27 coffee harvest would increase 12 percent year on year to 71.4 million bags. On March 19, Marex Group projected a record Brazilian crop of 75.9 million bags, surpassing Sucafina’s forecast of 75.4 million bags. On March 12, StoneX raised its Brazil 2026/27 production estimate to a record 75.3 million bags, up from a November estimate of 70.7 million bags. StoneX also projected the 2026 global coffee surplus would expand to 10 million bags from 1.8 million bags in 2025, the largest surplus in six years.

Vietnam Exports and ICE Inventories

Soaring coffee exports from Vietnam, the world’s largest robusta producer, are bearish for robusta prices. On May 9, Vietnam’s National Statistics Office reported that the country’s coffee exports in the first four months of 2026 rose 15.8 percent year on year to 810,000 metric tons. Vietnam’s 2025 coffee exports jumped 17.5 percent to 1.58 million metric tons. Production for the 2025/26 season is projected to climb 6 percent to a four year high of 1.76 million metric tons, equivalent to 29.4 million bags.

ICE coffee inventories have trended lower over the past two months, which typically supports prices. ICE robusta inventories fell to a two year low of 3,631 lots last Friday, though they recovered to a two and a half week high of 3,845 lots on Wednesday. ICE arabica coffee inventories fell to a two and three quarter month low of 456,462 bags on Wednesday.

Brazil Exports and Supply Disruptions

Smaller exports from Brazil are supportive of coffee prices. Last Tuesday, Cecafe reported that Brazil’s April green coffee exports fell 1.3 percent year on year to 2.76 million bags. The ongoing closure of the Strait of Hormuz has disrupted global coffee supplies and is bullish for prices. The closure has tightened supplies by increasing shipping rates, insurance, fertilizer and fuel costs, raising costs for importers and roasters.

As a bearish factor, the International Coffee Organization reported on November 7 that global coffee exports for the current marketing year (October to September) fell 0.3 percent year on year to 138.658 million bags.

USDA Production Forecasts

Indicator 2025/26 Forecast
World coffee production 178.848 million bags (+2.0% y/y record)
Arabica production 95.515 million bags (-4.7% y/y)
Robusta production 83.333 million bags (+10.9% y/y)
Brazil production 63 million bags (-3.1% y/y)
Vietnam production 30.8 million bags (+6.2% y/y, 4 year high)
Ending stocks 20.148 million bags (-5.4% y/y)

The USDA’s Foreign Agriculture Service bi-annual report of December 18 projected that world coffee production in 2025/26 would increase 2.0 percent year on year to a record 178.848 million bags. Within that total, arabica production is expected to decrease 4.7 percent to 95.515 million bags, while robusta production is forecast to rise 10.9 percent to 83.333 million bags. The USDA also forecast Brazil’s 2025/26 coffee production would decline 3.1 percent to 63 million bags, while Vietnam’s output would rise 6.2 percent to a four year high of 30.8 million bags. Ending stocks for 2025/26 are projected to fall 5.4 percent to 20.148 million bags from 21.307 million bags in 2024/25.

Frequently Asked Questions (FAQ)

1. Why are coffee prices falling?

Coffee prices are under pressure mainly due to expectations of a larger Brazilian coffee crop for 2026/27 and surging exports from Vietnam, pointing to a global surplus.

2. How low did arabica coffee prices go?

July arabica coffee futures fell to a one and a half year low on May 19, 2026, closing down 0.68% on May 20.

3. What is the projected Brazilian coffee crop for 2026/27?

The Coffee Trading Academy projects 71.4 million bags, while Marex Group and StoneX project record crops above 75 million bags.

4. How much did Vietnam’s coffee exports increase?

Vietnam’s coffee exports rose 15.8 percent in the first four months of 2026 compared to the same period last year, reaching 810,000 metric tons.

5. What is the expected global coffee surplus for 2026?

StoneX projects the 2026 global coffee surplus will expand to 10 million bags, the largest surplus in six years.

6. How does the Strait of Hormuz closure affect coffee prices?

The closure disrupts global coffee supplies by increasing shipping rates, insurance, and fuel costs, which is a bullish factor supporting prices.

Qahwa World – Based on Barchart commodity bulletin.
Published: May 20, 2026

Tanzania Coffee Production to Rise 10 Percent in 2026/27

Author: Qahwa World
Source: USDA Foreign Agricultural Service (FAS) Dar es Salaam
Date: May 20, 2026
Executive Summary:

  • FAS Dar es Salaam forecasts Tanzania coffee production to reach 1.6 million 60 kg bags in MY 2026/27, a 10.3 percent increase year on year.
  • The growth is driven by rehabilitated fields from 2019 to 2024 reaching full maturity and rising coffee prices incentivizing farmer investment.
  • Cultivated area is expected to expand from 270,000 hectares to 275,000 hectares, with harvested area increasing to 270,000 hectares.
  • Green bean exports are projected to rise 2.9 percent to 1.4 million bags, supported by higher production and strong global demand.
  • The European Union remains Tanzania’s leading coffee importer, purchasing five times more than the United States.
  • Domestic consumption is projected to increase from 85,000 to 90,000 bags, driven by growing urban coffee culture in Dar es Salaam and Arusha.
  • Ending stocks are expected to rise sharply to 157,000 bags due to production outpacing consumption and export growth.

Tanzania’s coffee production is projected to reach 1.6 million 60 kilogram bags in the 2026/27 marketing year, up from 1.45 million bags the previous year, representing a 10.3 percent increase.

This growth is attributed to rehabilitated fields from 2019 to 2024 reaching full maturity. Rising coffee prices have incentivized farmers to expand plantations, invest in advanced fertilizers and equipment, and enhance efficiency.

Stable prices have strengthened cooperative societies, expanding support and training for growers. Favorable rainfall and steady temperatures have improved growing conditions, helping the sector recover from past droughts and increasing yields. Strong global demand continues to drive production and exports, reinforcing Tanzania’s position in the coffee market.

Crop Area Expansion

Tanzania’s coffee sector is expected to expand by nearly two percent, with cultivated area rising from 270,000 hectares in MY 2025/26 to 275,000 hectares in MY 2026/27. This rise is driven mainly by robusta farmers in Kagera and Kigoma who are opening new land and are supported by subsidized seedlings and strong farm gate prices. Harvested area is projected to increase by a similar percentage from 265,000 hectares to 270,000 hectares as new farms mature.

Coffee is the country’s leading cash crop, grown by over 40 percent of farmers and covering 39 percent of permanent cropland. Production occurs through three systems: pure stand smallholder farms in the south, coffee banana intercropping in the north and west, and larger estates. Overall, larger estates contribute under 10 percent of output. Most smallholders cultivate about 0.63 hectares with older trees and 400 to 2,000 trees per farm. Tanzania produces arabica in the northern and southern highlands and robusta almost entirely in Kagera near Lake Victoria.

Production and Inputs

Indicator MY 2024/25 MY 2025/26 MY 2026/27 (Forecast)
Area harvested (1000 HA) 265 265 270
Arabica production (1000 bags) 700 750 850
Robusta production (1000 bags) 650 700 750
Total production (1000 bags) 1,350 1,450 1,600
Bean exports (1000 bags) 1,250 1,360 1,400
Domestic consumption (1000 bags) 77 85 90
Ending stocks (1000 bags) 50 51 157

Tanzania is one of the three leading producers of the Colombian mild arabica variety, contributing about six percent of global supply. Roughly 320,000 smallholder farmers produce 90 percent of the crop, with about 100 large estates accounting for the rest.

Fertilizer subsidies in Tanzania primarily support tobacco, corn, and rice producers, with minimal assistance directed toward coffee farmers. In February 2026, the government reduced its fertilizer subsidy from covering roughly half the market price to a flat rate of approximately 0.38 US dollars per 50 kg bag. High fertilizer prices have long prevented farmers from applying adequate nutrients, keeping average use near 50 kilograms per hectare.

Policy and Trade

Tanzania is expanding climate resilient coffee varieties, widening cultivation, improving input support, and upgrading processing and agronomic practices. Recent reforms include a 30 million US dollar memorandum of understanding with Corus International that focuses on large scale seedling distribution, stronger disease control programs, digitalized auctions, and tighter export licensing rules. The policy aims to boost transparency, traceability, and competitiveness in premium markets.

The Tanzania Coffee Board’s directive of April 24, 2026, established benchmark prices of 4.61 US dollars per kilogram for processing unit parchment arabica, 3.65 dollars for home processed parchment arabica, 1.54 dollars for robusta dry cherry, and 1.96 dollars for hard arabica dry cherry.

Green bean exports are projected to rise 2.9 percent to 1.4 million bags in MY 2026/27, supported by higher production and strong global demand. The European Union remains Tanzania’s leading coffee importer, purchasing five times more than the United States. Japan also remains a key destination for Tanzanian coffee, particularly for premium arabica.

Export Destinations and Soluble Coffee Decline

Destination 2022 (bags) 2023 (bags) 2024 (bags) 2025 (bags)
European Union 588,354 749,451 652,891 596,487
Japan 281,684 204,779 200,254 193,718
United States 58,841 79,586 112,720 128,032
Morocco 49,678 93,941 52,226 69,192
India 17,928 36,326 50,934 30,594

The United States is rapidly emerging as a major growth market for Tanzanian coffee, with imports rising from 58,841 bags in 2022 to 128,032 bags in 2025. Meanwhile, soluble coffee exports from Tanzania collapsed dramatically between 2022 and 2025, falling from 10,858 bags to just 814 bags, a drop of more than 92 percent. The EU and Kenya, once the two largest buyers, slashed imports from several thousand bags to only 446 and 88 bags respectively by 2025.

Domestic Consumption and Stocks

Tanzania’s coffee consumption is projected to increase from 85,000 to 90,000 bags in 2026/27, driven primarily by a growing urban coffee culture in Dar es Salaam and Arusha. Rising incomes and urbanization are encouraging younger professional consumers to incorporate coffee into their daily routines. Tourism further reinforces demand, as hotels and operators serving visitors expand their coffee offerings.

Projected coffee stocks for MY 2026/27 are expected to rise sharply to 157,000 bags, up from 51,000 bags in MY 2025/26, reflecting a significant supply driven buildup. The surge is primarily the result of higher production outpacing the country’s relatively modest growth in domestic consumption and exports.

Frequently Asked Questions (FAQ)

1. How much will Tanzania coffee production increase in 2026/27?

FAS Dar es Salaam forecasts a 10.3 percent increase to 1.6 million 60 kg bags, driven by rehabilitated fields reaching maturity and rising prices.

2. What is driving the expansion of coffee area in Tanzania?

Robusta farmers in Kagera and Kigoma are opening new land, supported by subsidized seedlings and strong farm gate prices. Cultivated area is expected to reach 275,000 hectares.

3. Which countries are the top buyers of Tanzanian coffee?

The European Union remains the leading importer, followed by Japan and the United States, which has shown rapid growth in recent years.

4. What happened to Tanzania’s soluble coffee exports?

Soluble coffee exports collapsed by more than 92 percent between 2022 and 2025, falling from 10,858 bags to just 814 bags.

5. How is domestic coffee consumption changing in Tanzania?

Domestic consumption is projected to rise from 85,000 to 90,000 bags, driven by growing urban coffee culture in Dar es Salaam and Arusha and rising tourism demand.

6. Why are ending stocks expected to increase sharply?

Production is outpacing the relatively modest growth in domestic consumption and exports, leading to a supply driven buildup to 157,000 bags.

Qahwa World – Based on USDA FAS Coffee Annual report TZ2026-0003 by Benjamin Mtaki, approved by Damian Ferrese.
Published: May 20, 2026

ICO Coffee Market Report April 2026: Global prices fall 2.7% as supply outlook outweighs Strait of Hormuz disruption

Author: Qahwa World – London

Source: International Coffee Organization (ICO) – Coffee Market Report, April 2026
Report number: N/A (monthly market report)
Date: May 2026

ICO Composite Indicator Price averages 266.24 US cents/lb; Robusta drops 6.9% (fifth consecutive monthly decline); certified stocks remain at historically low levels.

LONDON, May 2026 — The International Coffee Organization (ICO) Composite Indicator Price (I‑CIP) averaged 266.24 US cents per pound in April 2026, a 2.7 percent decrease from March 2026. The market balanced two opposing forces: the closure of the Strait of Hormuz since 4 March, which pushed crude oil prices up by 55.8 percent and shipping freight costs by 43.6 percent between 27 February and 30 April, against a continued improvement in the global supply outlook. On balance, the supply‑side factor outweighed the geopolitical disruption, erasing most of March’s gains.

All coffee groups recorded losses in April, with Robusta suffering the steepest decline. The ICO report highlights that since the end of coffee year 2024/25, Robusta prices have dropped 21.9 percent, while the I‑CIP fell 18.0 percent and the three Arabica groups declined by an average of 16.9 percent. The sharper downturn in Robusta is attributed to improved supply availability — Robusta green bean exports rose 16.7 percent in the first half of 2025/26 — and a 4.5 percentage point increase in its share of total green exports.

Key takeaway: The market has largely priced in the war, while fundamentals (supply and demand) are now driving prices downward. The I‑CIP dropped 2.7% in April, compared to a 2.3% increase in March when geopolitical fears dominated.

Price performance by group and futures markets

The Colombian Milds and Other Milds both contracted by 0.9 percent in April, averaging 334.56 and 331.32 US cents/lb respectively. Brazilian Naturals fell 2.1 percent to 313.76 US cents/lb. Robusta declined 6.9 percent to 164.64 US cents/lb. At the futures level, the London ICE Robusta market dropped 7.0 percent to 150.65 US cents/lb, while New York ICE Arabica fell 1.9 percent to 284.63 US cents/lb.

IndicatorMarch 2026April 2026ChangeICO Composite (US cents/lb)273.70266.29-2.7%Colombian Milds337.45334.52-0.9%Other Milds334.34331.52-0.8%Brazilian Naturals320.51314.29-1.9%Robustas176.77164.17-7.1%New York ICE (Arabica)290.18284.75-1.9%London ICE (Robusta)161.91150.19-7.2%

Strait of Hormuz blockage: a lasting impact on input costs

Since 4 March 2026, shipping flows through the Strait of Hormuz have remained disrupted. Around one‑fifth of the world’s oil supply passes through this corridor. Between 27 February and 30 April, Brent crude rose from US$73.23/bbl to US$114.09/bbl, an increase of 55.8 percent. The Containerized Freight Index climbed from 1,331.1 to 1,911.4 points, a 43.6 percent rise. Fertilizer urea price jumped 47 percent from US$465/t to US$682/t over the same two‑month period. The Gulf region is a major fertilizer producer; Qatar Fertiliser Company alone accounts for about 14 percent of global urea production. The ICO notes that the increase in urea prices will hit high‑input coffee origins most severely, especially producers who have not secured fertilizers in advance for the main nitrogen application period supporting flowering for the next harvest.

Global supply outlook improves – market forecasts point to larger crops

Throughout March and April, several market players released optimistic projections. On 18 March, Scaufina projected Brazil’s 2026/27 crop to be up 15.5 percent year‑on‑year. On 19 March, Marex Group projected a 14.3 percent increase. On 2 April, StoneX projected global 2026 production at 182.5 million bags, an increase of 9.6 percent over the previous year, and forecast world stocks to rise to 48.2 million bags from 38.3 million in 2025.

These fundamentals gained the upper hand in April, as the market appeared to have already factored in the war. The I‑CIP’s 2.7 percent decline reversed the 2.3 percent increase seen in March, when geopolitical shocks dominated.

Price differentials and arbitrage

The Colombian Milds–Other Milds differential widened slightly from 3.12 to 3.34 US cents/lb. The Colombian Milds–Brazilian Naturals differential grew 22.7 percent to 20.8 US cents/lb. The arbitrage between New York and London futures markets increased 4.5 percent to 133.99 US cents/lb in April, the second consecutive monthly increase. The arbitrage ratio (New York/London) stood at 1.89, above the historical average of 1.75 (January 2018 to May 2025). The ratio has remained above the historic average for 11 of the past 12 months, indicating a return to more typical arbitrage levels.

Volatility declines across all indicators

Intra‑day volatility of the I‑CIP averaged 9.0 percent in April, down 0.8 percentage points from March. Colombian Milds volatility fell to 8.5 percent, Other Milds to 8.8 percent, Brazilian Naturals to 9.7 percent, and Robustas to 10.7 percent. New York futures volatility decreased to 10.0 percent, London to 11.0 percent.

Certified stocks remain at historic lows

London certified Robusta stocks fell 5.5 percent month‑on‑month to 0.65 million bags in April. US certified Arabica stocks dropped 10.1 percent to 0.55 million bags. Stock levels have stabilized in the last six months but remain at historically very low levels. From January 2010 to December 2021, average total ICE stocks were 4.87 million bags. Since the end of 2021, total certified stocks have stayed below 3.0 million bags. Calculated as months of EU and US consumption, current stocks represent just 0.22 months’ worth, compared to an average of 0.91 months between 2010 and 2021.

Green bean exports: mixed performance by group

Global green bean exports in March 2026 rose 0.8 percent to 11.7 million bags. Robusta exports surged 24.0 percent to a record 5.52 million bags, driven by Vietnam (up 30.3 percent to 3.67 million bags) and supported by Brazil and India. Colombian Milds exports fell 33.8 percent to 0.88 million bags, the fifth consecutive monthly decline, as Colombia’s exports dropped 37.4 percent due to falling local supply. Other Milds exports edged up 0.9 percent to 2.59 million bags, led by Honduras (+19.3%). Brazilian Naturals exports declined 16.8 percent to 2.71 million bags, marking the 13th consecutive month of negative growth, driven primarily by Brazil.

Total Arabica exports fell 13.6 percent to 6.18 million bags in March 2026. As a result, Arabica’s share of total green bean exports for the first six months of 2025/26 fell to 59.6 percent from 64.5 percent a year earlier.

Coffee group March 2025 (million bags) March 2026 (million bags) Change
Robustas 4.45 5.52 +24.0%
Colombian Milds 1.33 0.88 -33.8%
Other Milds 2.57 2.59 +0.9%
Brazilian Naturals 3.26 2.71 -16.8%

Total exports by region (all forms of coffee)

Global exports of all forms of coffee increased 1.6 percent to 13.59 million bags in March 2026. Asia & Oceania led growth with a 13.1 percent rise to 5.82 million bags, driven by Vietnam’s 25.1 percent increase to 4.3 million bags – the country’s largest‑ever March export volume and second‑highest monthly volume on record. This was partly offset by Indonesia, whose exports fell an estimated 47.6 percent to 0.45 million bags.

Africa’s exports fell 14.7 percent to 1.4 million bags, led by Ethiopia (down 29.7% to 0.44 million bags). South America’s exports declined 8.3 percent to 4.07 million bags, with Colombia down 28.5 percent to 0.9 million bags – the fourth consecutive monthly downturn. The Caribbean, Mexico & Central America rose 7.1 percent to 2.3 million bags, led by Honduras (+19.3%).

Exports by form: soluble coffee up 6.6%

Green beans accounted for 85.23 percent of total exports in the first half of 2025/26, soluble coffee 14.21 percent, and roasted coffee 0.56 percent. Soluble coffee exports rose 6.6 percent to 1.82 million bags in March 2026, with Vietnam (0.56 million bags), Brazil (0.4 million), and India (0.28 million) as the largest shippers. Roasted bean exports increased 21.0 percent to 0.07 million bags.

Global supply/demand balance

According to ICO data, 2023/24 world production reached 177.5 million bags, up 5.2 percent from the previous year. Arabica production rose 4.5 percent to 102.1 million bags, Robusta 6.2 percent to 75.4 million bags. Consumption in 2023/24 was 175.1 million bags, up 1.4 percent, resulting in a positive balance of 2.44 million bags – the first surplus after three consecutive deficits.

Frequently Asked Questions

  • What was the ICO Composite Indicator Price in April 2026?
The I‑CIP averaged 266.24 US cents per pound, a 2.7 percent decrease from March 2026.
  • How much have Robusta prices fallen since the end of coffee year 2024/25?
Robusta prices have dropped 21.9 percent since the end of coffee year 2024/25, while the I‑CIP fell 18.0 percent and the three Arabica groups declined by an average of 16.9 percent.
  • How did the Strait of Hormuz closure affect shipping and fertilizer costs?
The Containerized Freight Index rose 43.6 percent and urea prices jumped 47 percent between 27 February and 30 April 2026.
  • What are market analysts forecasting for Brazil’s 2026/27 crop?
Scaufina projected a 15.5 percent increase, and Marex Group projected a 14.3 percent increase year‑on‑year.
  • How much green Robusta coffee was exported in March 2026?
Robusta green bean exports reached 5.52 million bags, a 24.0 percent increase from March 2025, the largest ever monthly volume on record.
  • What is the current level of certified stocks compared to historical averages?
Current certified stocks represent just 0.22 months of EU and US consumption, compared to an average of 0.91 months between 2010 and 2021.
Source: International Coffee Organization (ICO) – Coffee Market Report, April 2026 (published May 2026). All figures and analysis are strictly based on the original report. No external data has been added.

Related Stories:

March 2026 Coffee Market Report: Global Prices Rebound Amid Geopolitical Tension

ICO February 2026 Report: Has the Inflationary Wave Receded?

Global Coffee Market Roadmap—January 2026

ICO Releases Global Coffee Market Report – December 2025


Indonesian Coffee Output Drops 8% to 11.38 Million Bags

Author: Qahwa World – Jakarta
Source: USDA Foreign Agricultural Service – Jakarta Office
Report Number: ID2026-0021
Date: May 15, 2026

Executive Summary
• Indonesian coffee production for MY 2026/27 is forecast at 11.38 million 60-kg bags, down 8% from the previous year.
• Robusta output falls to 10 million bags, a drop of 1 million bags, due to excessive rains in southern Sumatra and Central Java.
• Arabica production for 2025/26 is revised down to 1.37 million bags following Typhoon Sinyar floods in Aceh and North Sumatra.
• Farmgate prices: Robusta down 16% from 2025 peaks; Arabica down 14% since October 2025.
• Exports are forecast at 7 million bags in 2026/27, down 11% due to lower supplies and strong domestic demand.
• European imports of Indonesian coffee jumped 72% to 2.4 million bags in 2025/26.
• Domestic consumption is projected at 4.83 million bags, driven by soluble coffee and the kopi susu trend.
• Some Arabica plantations in Aceh may require 2-3 years to fully recover from flood damage.

1. Overview: Indonesia in the Global Coffee Market

Indonesia is the world’s fourth-largest coffee producer, after Brazil, Vietnam, and Colombia, and ahead of Ethiopia and Uganda. Approximately 75 percent of Indonesian coffee production is exported. Robusta accounts for nearly 88 percent of total output, making Indonesia the largest Robusta producer in Asia and a key supplier to European and US markets.

According to the USDA FAS report from the Jakarta office, Indonesia’s coffee sector faces significant climate-related challenges. Excessive rainfall during the flowering and fruit development phases in late 2025 and early 2026 has severely damaged Robusta crops in southern Sumatra and Central Java. Meanwhile, Arabica-growing areas in Aceh and North Sumatra are still recovering from floods and landslides caused by Typhoon Sinyar in November 2025.

Key insight: Robusta dominates Indonesian coffee production at 88 percent. Smallholders farming 1-2 hectares represent about 98 percent of total coffee area, making the sector highly vulnerable to weather shocks and infrastructure disruptions.

2. Production Forecast: MY 2026/27

FAS Jakarta forecasts Indonesian coffee production for MY 2026/27 at approximately 11.38 million 60-kg bags (682,800 metric tons), comprising 1.38 million bags of Arabica (82,800 tons) and 10.00 million bags of Robusta (600,000 tons). This represents an 8 percent decline from the revised 2025/26 estimate of 12.37 million bags.

Table 1: Indonesian Coffee Production (million 60-kg bags)

Category 2021/22 2022/23 2023/24 2024/25 2025/26 Revised 2026/27 Forecast
Arabica 1.30 1.40 1.40 1.40 1.37 1.38
Robusta 9.30 10.50 6.80 9.30 11.00 10.00
Total 10.60 11.90 8.20 10.70 12.37 11.38

3. Climate Challenges: Rains and Typhoon Damage

The main driver of Indonesia’s production decline is abnormal rainfall during flowering and fruit development. In mid-2025, excessive rains disrupted Robusta flowering in the southern Sumatra highlands. In Central Java, farmers reported heavy rains that caused flowers to drop and pollen to wash away, interrupting pollination and reducing fruit set.

In Aceh and North Sumatra, Arabica areas continue to suffer from flooding caused by Typhoon Sinyar in late November 2025. As of April 2026, infrastructure recovery remains incomplete, keeping transport costs high. Several processing facilities and warehouses were also damaged. Some Arabica plantations may need 2-3 years to recover. The main harvest in Aceh, normally from October to November, was delayed into early 2026.

Looking ahead, Indonesia’s National Weather Agency (BMKG) projects that the 2026 dry season will be significantly drier and longer than average due to a weak El Niño expected to strengthen to moderate levels in the second half of 2026. In Sumatra, the dry season will begin in April-May 2026, starting in Aceh and North Sumatra, then spreading to Lampung and South Sumatra, peaking around August 2026. El Niño conditions typically increase drought risk, which can further disrupt flowering.

Table 2: Rainfall Impact on Key Regions (2025-2026)

Region Event Impact Recovery Timeline
Southern Sumatra Highlands Excessive rains (mid-2025) Disrupted Robusta flowering Lower yields in 2026/27
Central Java Heavy rains, pollen washout Poor fruit development Lower harvest expected
Aceh & North Sumatra Typhoon Sinyar floods (Nov 2025) Damaged Arabica farms, destroyed infrastructure 2-3 years

4. Yield Projections

For MY 2026/27, Robusta yields are expected to decline due to rainfall disruptions, though the report did not provide specific yield per hectare figures. Historically, Indonesian Robusta yields remain below one metric ton per hectare and vary significantly by region. Arabica yields in Aceh and North Sumatra are expected to stay low until infrastructure and farms recover.

Adoption of improved, higher-yielding seedlings remains limited because most farmers rely on locally sourced planting material. Government distribution of subsidized seedlings and farmer training programs also remain limited in geographic coverage.

5. Price Dynamics: Decline from 2025 Peaks

Farmgate and spot prices for both Robusta and Arabica have declined significantly from their 2025 highs. According to spot price data from Lampung (Robusta) and Medan (Arabica), prices have moderated due to improved global supply expectations and weaker demand from some roasteries.

Robusta spot prices in Lampung peaked above 104,000 IDR/kg in February 2025 but fell to around 66,661 IDR/kg by April 2026, a drop of roughly 36 percent from the peak. Year-on-year (April 2025 to April 2026), Robusta prices fell 32 percent. Compared to October 2025 (84,128 IDR/kg), the decline is about 21 percent.

Arabica spot prices in Medan peaked above 229,835 IDR/kg in November 2025 but fell to around 174,162 IDR/kg by April 2026, a drop of roughly 24 percent from the peak. Compared to October 2025 (219,802 IDR/kg), the decline is about 21 percent.

Table 3: Robusta Spot Prices in Lampung (IDR/kg) – Selected Months

Month 2024 2025 2026 Change (Oct 2025 to Apr 2026)
January 56,069 94,724 78,595 -21%
February 55,854 104,371 70,862
March 59,018 102,373 69,785
April 72,712 98,659 66,661

6. Export Outlook: Lower Supplies, Stronger European Demand

FAS forecasts green bean exports for 2026/27 at 7 million bags, down 11 percent from 2025/26, due to lower exportable supplies and continued strong domestic demand. Total exports (including roasted and soluble) are forecast at 8.05 million bags.

Despite the overall decline, shipments to European markets rose 72 percent to 2.4 million bags in 2025/26 compared to the previous year. This reflects renewed demand for Indonesian beans, particularly from Belgium and Germany, supported by recovered supplies, competitive pricing, and EUDR compliance readiness.

The United States remains among Indonesia’s top five destinations, with steady demand between 680,000 and 950,000 bags over the past five years. In 2025/26, shipments to the US ranked third at 797,000 bags. These shipments typically consist of 60-80 percent Arabica beans, mostly exported through the Port of Belawan in North Sumatra.

Table 4: Indonesian Green Bean Exports by Destination (1,000 60-kg bags, 2025/26)

Rank Destination Volume (1,000 bags) Share
1 Europe (total) 2,400 ~30%
2 United States 797 ~10%
3 Others ~3,800 ~60%

7. Trade Agreements and Policy Environment

Unlike India, Indonesia has no newly ratified free trade agreements specifically targeting coffee exports to Europe. However, the country continues to benefit from existing Generalized System of Preferences (GSP) facilities. Exporters have reported higher freight costs and shipping delays linked to the Middle East conflict in the last quarter of 2025/26, which affected some shipments.

Rupiah depreciation against the US dollar supported stronger demand toward the end of 2025/26. Prices for lower-grade Arabica strengthened through March 2026 as access improved, though transport costs reportedly doubled in affected areas.

8. Domestic Consumption: A Growing Market

FAS forecasts domestic consumption for 2026/27 at 4.83 million bags (289,800 metric tons), up 20,000 bags from the previous year, supported by continued demand from roasteries and processors. Local roasteries have faced squeezed margins as green bean prices rose since 2024, and weaker purchasing power in 2025/26 shifted some demand toward low- to medium-grade coffee. With green bean prices easing in early 2026, demand from roasteries should remain strong.

At the consumer level, low-priced coffee sold by street vendors remains popular among workers and low- to middle-income consumers. Coffee outlets in public venues serve higher-end consumers, including Gen-Z. Kopi susu (coffee with milk) remains a popular entry-level drink, widely available in coffee shops and ready-to-drink products.

Table 5: Indonesian Domestic Consumption (million 60-kg bags)

Category 2024/25 2025/26 2026/27 Forecast
Roast & Ground Domestic 3.343 3.270 3.280
Soluble Domestic 1.530 1.540 1.550
Total Domestic Consumption 4.873 4.810 4.830

9. Long-Term Vision and Recovery Outlook

Indonesia has no publicly stated long-term production target comparable to India’s 2047 vision. However, the government and the Coffee Board of Indonesia (under the Ministry of Agriculture) have promoted sustainability programs and EUDR compliance support. The BMKG’s El Niño forecast for the second half of 2026 poses additional risks. Recovery for Arabica plantations in Aceh is expected to take 2-3 years, while Robusta areas may rebound in 2027/28 if normal rainfall returns.

10. Imports: Filling the Gap

FAS forecasts green bean imports for 2026/27 at 1.42 million bags (85,200 metric tons), up slightly from 1.415 million bags in 2025/26. Indonesian green bean imports are closely tied to production and local demand, jumping from around 230,000 bags in 2020/21 to a peak of 942,000 bags in 2023/24, then dropping to around 372,000 bags in 2025/26. The 2023/24 spike reflects weak domestic supply and strong demand for specialty beans and the growing ready-to-drink sector.

Green beans account for approximately 94 percent of total imports and are primarily sourced from Nicaragua, Vietnam, Brazil, and Kenya for processing and re-export.

11. Key Challenges Facing Indonesian Coffee Sector

  • Climate variability: Excessive rains during flowering (mid-2025) followed by El Niño drought (late 2026) create extreme weather shocks.
  • Infrastructure damage: Typhoon Sinyar destroyed roads, bridges, processing facilities, and warehouses in Aceh and North Sumatra. Recovery remains incomplete as of April 2026.
  • Smallholder vulnerability: 98 percent of coffee area is farmed by smallholders with limited access to credit, improved seedlings, or crop insurance.
  • Fertilizer costs: Rising input costs and fertilizer supply uncertainty continue to pressure farmer margins.
  • Freight disruptions: The Middle East conflict has increased shipping costs and caused delays, affecting export competitiveness.
  • Limited replanting programs: No major replanting or expansion programs have been implemented recently, leaving aging trees in place.

12. Opportunities

  • EUDR preparedness: Indonesian exporters have prepared for EU deforestation regulations, potentially gaining market share in Europe.
  • Growing domestic market: Rising coffee culture among Gen-Z and the popularity of kopi susu and ready-to-drink products.
  • Soluble coffee demand: Domestic soluble consumption is projected to remain strong at 1.55 million bags.
  • Rupiah depreciation: A weaker rupiah supports export competitiveness despite lower prices.
  • Recovery potential: Once infrastructure is rebuilt and rainfall normalizes, Indonesian Robusta production can rebound quickly.

Frequently Asked Questions

  • How much coffee will Indonesia produce in 2026/27?

According to the USDA FAS report, Indonesia is forecast to produce 11.38 million 60-kg bags (approximately 682,800 metric tons) in MY 2026/27, comprising 1.38 million bags of Arabica and 10.00 million bags of Robusta. This is an 8 percent decrease from the previous year.

  • Why is Robusta production expected to decline?

Robusta production is projected to fall by 1 million bags (to 10 million bags) due to excessive rains in mid-2025 that disrupted flowering in southern Sumatra highlands and heavy rains in Central Java that caused flowers to drop and pollen to wash away, interrupting pollination.

  • What happened to Arabica production in Aceh and North Sumatra?

Typhoon Sinyar in late November 2025 caused severe floods and landslides, damaging Arabica plantations, processing facilities, and infrastructure. Recovery is expected to take 2-3 years. The main harvest in Aceh was delayed into early 2026.

  • How have coffee prices changed in Indonesia?

Robusta spot prices in Lampung fell from a peak above 104,000 IDR/kg in February 2025 to around 66,661 IDR/kg in April 2026 (down 36% from peak). Arabica spot prices in Medan fell from above 229,835 IDR/kg in November 2025 to around 174,162 IDR/kg in April 2026 (down 24% from peak).

  • What are Indonesia’s main coffee export markets?

Europe is the largest destination, with shipments rising 72 percent to 2.4 million bags in 2025/26, led by Belgium and Germany. The United States ranks third at 797,000 bags. Other markets include Japan, Canada, and the Middle East.

  • How much coffee does Indonesia consume domestically?

Domestic consumption is forecast at 4.83 million bags in 2026/27, with soluble coffee accounting for about 1.55 million bags. Kopi susu (coffee with milk) remains a popular entry-level drink.

Author: Qahwa World – Jakarta
Source: USDA Foreign Agricultural Service – Report ID2026-0021
Date: May 15, 2026
Report Availability: The full USDA report can be accessed through the USDA PSD Online Advanced Query system.

Similar stories:

USDA Report: India’s Coffee Sector Faces Climate Challenges and Historic Trade Opportunities

Mexico Coffee Production Forecast to Reach 4.1 Million Bags in 2026/2027

Honduran coffee production surges to 5.53 million bags

Coffee Prices Decline as Expectations of Ample Brazilian Crop Weigh on Market

Author: Qahwa World
Source: Barchart (Rich Asplund)
Date: May 18, 2026 Coffee prices decline ample supplies is the main story as the market experiences significant changes.
Executive Summary:

  • July arabica coffee fell to a 1.5 year low on Monday, closing down 1.01 percent. July robusta posted a 4 week low, closing down 1.75 percent.
  • The Coffee Trading Academy projects Brazil’s 2026/27 harvest will increase 12 percent year on year to 71.4 million bags.
  • Marex Group and StoneX both forecast record Brazilian crops exceeding 75 million bags for 2026/27.
  • StoneX projects the 2026 global coffee surplus will expand to 10 million bags, the largest in six years.
  • Vietnam coffee exports rose 15.8 percent in the first four months of 2026 compared to the same period last year.
  • ICE robusta inventories fell to a two year low last Friday, while arabica inventories dropped to a 2.75 month low.
  • The closure of the Strait of Hormuz continues to disrupt global coffee supplies, supporting prices.

Coffee prices extended their sharp losses from last Friday on May 18, 2026. July arabica coffee futures closed down 1.01 percent, reaching a one and a half year low. July robusta coffee fell 1.75 percent, hitting a four week low. The declines were driven largely by expectations of a larger Brazilian coffee crop and surging exports from Vietnam.

Market analysts are forecasting a record harvest in Brazil for the 2026/27 season. On May 7, the Coffee Trading Academy projected Brazil’s crop would increase 12 percent year on year to 71.4 million bags. Earlier forecasts from Marex Group and StoneX were even higher. Marex projected a record 75.9 million bags, while StoneX raised its estimate to 75.3 million bags. StoneX also predicted that the global coffee surplus would expand from 1.8 million bags in 2025 to 10 million bags in 2026, the largest surplus in six years.

Vietnam, the world’s largest robusta producer, is also adding to supply pressure. According to Vietnam’s National Statistics Office, coffee exports in the first four months of 2026 rose 15.8 percent year on year to 810,000 metric tons. For the full year 2025, Vietnam’s coffee exports jumped 17.5 percent to 1.58 million metric tons. Production for the 2025/26 season is projected to climb 6 percent to a four year high of 1.76 million metric tons, equivalent to 29.4 million bags.

Inventories and Supply Disruptions

ICE coffee inventories have trended lower over the past two months, which typically supports prices. ICE robusta inventories fell to a two year low of 3,631 lots last Friday. ICE arabica coffee inventories dropped to a 2.75 month low of 462,777 bags on Monday. Despite these declines, the broader supply outlook remains bearish.

Meanwhile, smaller exports from Brazil are providing some support. On May 12, Cecafe reported that Brazil’s April green coffee exports fell 1.3 percent year on year to 2.76 million bags. Additionally, the ongoing closure of the Strait of Hormuz has disrupted global coffee supplies. The closure has increased shipping rates, insurance costs, fertilizer and fuel prices, raising costs for coffee importers and roasters. This factor remains bullish for prices.

Key Market Data

Indicator Value
July arabica coffee close (May 18) Down 1.01% to 1.5 year low
July robusta coffee close (May 18) Down 1.75% to 4 week low
Brazil 2026/27 crop forecast (Coffee Trading Academy) 71.4 million bags (+12% y/y)
Brazil 2026/27 crop forecast (Marex Group) 75.9 million bags (record)
Brazil 2026/27 crop forecast (StoneX) 75.3 million bags (record)
Projected 2026 global coffee surplus 10 million bags (largest in 6 years)
Vietnam coffee exports (Jan-Apr 2026) 810,000 MT (+15.8% y/y)
ICE robusta inventories (May 15) 3,631 lots (2 year low)
ICE arabica inventories (May 18) 462,777 bags (2.75 month low)

Global Export and Production Outlook

On November 7, the International Coffee Organization reported that global coffee exports for the current marketing year (October to September) fell 0.3 percent year on year to 138.658 million bags. This decline is a bearish factor for prices.

The USDA Foreign Agriculture Service released a bi-annual report on December 18 projecting that world coffee production in 2025/26 would increase 2.0 percent year on year to a record 178.848 million bags. Within that total, arabica production is expected to decrease 4.7 percent to 95.515 million bags, while robusta production is forecast to rise 10.9 percent to 83.333 million bags. The USDA also forecast that Brazil’s 2025/26 coffee production would decline 3.1 percent to 63 million bags, while Vietnam’s output would rise 6.2 percent to a four year high of 30.8 million bags. Ending stocks for 2025/26 are projected to fall 5.4 percent to 20.148 million bags from 21.307 million bags in 2024/25.

Frequently Asked Questions (FAQ)

1. Why are coffee prices falling?

Coffee prices are under pressure mainly due to expectations of a larger Brazilian coffee crop for 2026/27 and surging exports from Vietnam, which point to a global surplus.

2. How low did arabica coffee prices go?

July arabica coffee futures fell to a one and a half year low on May 18, 2026, closing down 1.01 percent.

3. What is the projected Brazilian coffee crop for 2026/27?

Forecasts vary, but the Coffee Trading Academy projects 71.4 million bags, while Marex Group and StoneX project record crops above 75 million bags.

4. How much did Vietnam’s coffee exports increase?

Vietnam’s coffee exports rose 15.8 percent in the first four months of 2026 compared to the same period last year, reaching 810,000 metric tons.

5. What is the expected global coffee surplus for 2026?

StoneX projects the 2026 global coffee surplus will expand to 10 million bags, the largest surplus in six years.

6. How does the Strait of Hormuz closure affect coffee prices?

The closure disrupts global coffee supplies by increasing shipping rates, insurance, and fuel costs, which is a bullish factor supporting prices.

Qahwa World – Based on market reports from Barchart by Rich Asplund.
Published: May 18, 2026

Mexico Coffee Production Forecast to Reach 4.1 Million Bags in 2026/2027

Author: Qahwa World – Dubai
Source: USDA Foreign Agricultural Service – Mexico City Office
Report Number: MX2026-0026
Date: May 14, 2026
Executive Summary

  • Mexico coffee production forecast at 4.1 million green bean equivalent bags for MY 2026/2027
  • Production expected to increase 1 percent year-over-year driven by robusta expansion
  • Mexican coffee consists of 85 percent arabica and 15 percent robusta
  • Chiapas, Veracruz, and Puebla account for more than 80 percent of national production
  • Domestic consumption projected to rise 1 percent to 3.2 million bags
  • United States remains primary destination for Mexican coffee exports
  • Soluble coffee covers approximately 60 percent of domestic consumption

The USDA Foreign Agricultural Service forecasts Mexico coffee production for marketing year 2026/2027 at 4.1 million green bean equivalent bags, a 1 percent increase from the previous year. This marginal growth is driven by sustained investment following two years of favorable market prices and the continued expansion of robusta production.

Mexican coffee production consists of 85 percent arabica and 15 percent robusta. The three main producing states are Chiapas, Veracruz, and Puebla, which together account for more than 80 percent of national output.

Production outlook by region

Chiapas is forecast to remain the top coffee-producing state by volume in MY 2026/2027. Puebla is expected to have the highest yields at 13 green bean equivalent bags per hectare, more than double the national average. This exceptional performance is due to favorable soil conditions, investments in leaf-rust resistant plants, and infrastructure near major cities. Veracruz ranks as the second highest yielding state.

Despite a decline from 2025 peaks, coffee prices in early 2026 continue to trend well above historical averages. According to the International Coffee Organization, arabica prices averaged 331 US cents per pound as of March 2026, which is 40 percent above the ten-year average.

This extended period of profitability has enabled producers in Chiapas, Veracruz, and Puebla to reinvest in farm management. Growers have increased plant density, input application, and quality control measures. The adoption of new varieties resistant to coffee leaf rust is forecast to continue growing the sector without expanding planted area.

Key insight: Following years of widespread coffee leaf rust outbreaks, Mexican producers have gradually transitioned toward replanting arabica rust-resistant varieties. These plants are currently in their early growth stages and have yet to fruit, but they are expected to lay the foundation for a more resilient and productive sector in the coming years.

Robusta expansion

Mexico is expanding robusta production due to its resilience against disease, ability to thrive in lower-altitude climates, and demand from large soluble coffee processors. According to industry contacts, large-scale processors have prioritized local sourcing. They provide robusta farmers with contract agreements and price stability. The main producer of robusta is Chiapas, followed by Veracruz, Puebla, and Oaxaca.

For MY 2025/2026, production is estimated at 4 million green bean equivalent bags, a 4 percent increase over the previous year. This growth is driven by recovery from heat waves that affected robusta fields in MY 2024/2025. Increased investment in both robusta and arabica management, enhanced pre- and post-harvest practices, and selective harvesting to secure higher quality and market premiums have also contributed.

Domestic consumption trends

Coffee consumption is forecast at 3.2 million green bean equivalent bags for MY 2026/2027, an increase of 1 percent from the previous year. This slight growth is attributed to expansion in retail coffee shops and chains, as well as changing consumption habits favoring premium coffee.

Convenience stores are increasing the availability of ready-to-drink coffee. Caffeine, a coffee company in northern Mexico, has entered a partnership with OXXO, the largest convenience store chain in Mexico. Caffeine produces, roasts, and supplies coffee for nearly all OXXO stores in Mexico and Colombia, ensuring high quality and fast coffee service across the chain network.

Mexico is also Starbucks’ largest market in Latin America and the Caribbean, and its seventh largest globally. With an expansion of approximately 70 new stores annually, the company plans to reach 1,000 stores in the country during 2026.

Major urban areas in Mexico are showing higher demand for high-quality, single-origin coffee. This has created new markets for premium coffee products such as capsules, cold brew, and specialty offerings. Microlots are growing in popularity to meet demand for unique sensory profiles and limited editions.

Online platforms in Mexico are increasing access to specialty coffee brands, single-origin beans, and subscription programs. This online channel enables small roasters to reach customers throughout the country, allowing customers to discover artisanal and responsibly sourced coffee products.

Despite growth in the premium sector, soluble coffee remains more practical and economical, covering approximately 60 percent of domestic consumption. Coffee tricycles, common in Mexico City and other cities, offer café de olla (roasted coffee prepared with cinnamon and sweetened), soluble coffee, and hot chocolate as an affordable and traditional alternative to coffee shops.

Export and import trends

Coffee exports for MY 2026/2027 are forecast at 3.4 million green bean equivalent bags, a decrease of 1 percent from the previous year. Gains in production are expected to satisfy domestic consumption, slightly reducing export volumes.

The United States remains the primary destination market for Mexican coffee in all forms. Exports to the United States reached 2.6 million green bean equivalent bags in 2025. Mexico primarily exports green bean and soluble coffee to the US market.

Coffee imports are forecast at 2.4 million green bean equivalent bags for MY 2026/2027, a decrease of 4 percent. This trend is driven by a forecasted rise in local robusta production, reducing the need for imported green beans. In 2025, the private sector announced various investment programs aimed at increasing coffee production capacity. As a result, Mexico is substituting soluble coffee imports with domestically manufactured products.

Government support programs

Mexico’s Secretariat of Agriculture and Rural Development operates several coffee-specific producer support programs. Production for Wellbeing provides direct financial support of 388 US dollars per producer per year. In 2026, a total of 181,364 producers participated, covering an area of 216,306 hectares.

Fertilizers for Wellbeing delivered 53,542 tons of fertilizer to 151,253 producers in 2026, benefiting an area of 165,984 hectares. This initiative seeks to enhance soil fertility and boost productivity among coffee growers and is expected to expand in scope for 2026.

Café Bienestar, managed by the Secretariat of Wellbeing, aims to distribute affordable coffee through the country network of Bienestar stores. The program buys coffee from producers in Chiapas, Oaxaca, Puebla, Veracruz, and Guerrero and processes it. This program is estimated to represent 3 to 4 percent of the total soluble coffee market.

Frequently Asked Questions

How much coffee will Mexico produce in 2026/2027?
The USDA forecasts Mexico coffee production at 4.1 million green bean equivalent bags for MY 2026/2027, a 1 percent increase from the previous year.

Which states produce the most coffee in Mexico?
Chiapas, Veracruz, and Puebla are the three main coffee-producing states, together accounting for more than 80 percent of national production. Chiapas remains the top producer by volume.

What is the breakdown between arabica and robusta in Mexico?
Mexican coffee production consists of 85 percent arabica and 15 percent robusta. Robusta production is expanding due to its disease resistance and demand from soluble coffee processors.

How is coffee leaf rust affecting Mexican production?
Following years of widespread coffee leaf rust outbreaks, producers have gradually transitioned to replanting arabica rust-resistant varieties. These plants are in early growth stages and are expected to create a more resilient sector.

What is the coffee consumption trend in Mexico?
Domestic consumption is forecast at 3.2 million bags, a 1 percent increase. Soluble coffee covers approximately 60 percent of consumption, while premium and specialty coffee segments are growing rapidly.

Who is the primary buyer of Mexican coffee?
The United States remains the primary destination market for Mexican coffee exports, receiving 2.6 million green bean equivalent bags in 2025.


Author: Qahwa World – Dubai
Source: USDA Foreign Agricultural Service – Mexico City Office
Report Number: MX2026-0026
Date: May 14, 2026