Mexico Coffee Production Forecast to Reach 4.1 Million Bags in 2026/2027

Author: Qahwa World – Dubai
Source: USDA Foreign Agricultural Service – Mexico City Office
Report Number: MX2026-0026
Date: May 14, 2026
Executive Summary

  • Mexico coffee production forecast at 4.1 million green bean equivalent bags for MY 2026/2027
  • Production expected to increase 1 percent year-over-year driven by robusta expansion
  • Mexican coffee consists of 85 percent arabica and 15 percent robusta
  • Chiapas, Veracruz, and Puebla account for more than 80 percent of national production
  • Domestic consumption projected to rise 1 percent to 3.2 million bags
  • United States remains primary destination for Mexican coffee exports
  • Soluble coffee covers approximately 60 percent of domestic consumption

The USDA Foreign Agricultural Service forecasts Mexico coffee production for marketing year 2026/2027 at 4.1 million green bean equivalent bags, a 1 percent increase from the previous year. This marginal growth is driven by sustained investment following two years of favorable market prices and the continued expansion of robusta production.

Mexican coffee production consists of 85 percent arabica and 15 percent robusta. The three main producing states are Chiapas, Veracruz, and Puebla, which together account for more than 80 percent of national output.

Production outlook by region

Chiapas is forecast to remain the top coffee-producing state by volume in MY 2026/2027. Puebla is expected to have the highest yields at 13 green bean equivalent bags per hectare, more than double the national average. This exceptional performance is due to favorable soil conditions, investments in leaf-rust resistant plants, and infrastructure near major cities. Veracruz ranks as the second highest yielding state.

Despite a decline from 2025 peaks, coffee prices in early 2026 continue to trend well above historical averages. According to the International Coffee Organization, arabica prices averaged 331 US cents per pound as of March 2026, which is 40 percent above the ten-year average.

This extended period of profitability has enabled producers in Chiapas, Veracruz, and Puebla to reinvest in farm management. Growers have increased plant density, input application, and quality control measures. The adoption of new varieties resistant to coffee leaf rust is forecast to continue growing the sector without expanding planted area.

Key insight: Following years of widespread coffee leaf rust outbreaks, Mexican producers have gradually transitioned toward replanting arabica rust-resistant varieties. These plants are currently in their early growth stages and have yet to fruit, but they are expected to lay the foundation for a more resilient and productive sector in the coming years.

Robusta expansion

Mexico is expanding robusta production due to its resilience against disease, ability to thrive in lower-altitude climates, and demand from large soluble coffee processors. According to industry contacts, large-scale processors have prioritized local sourcing. They provide robusta farmers with contract agreements and price stability. The main producer of robusta is Chiapas, followed by Veracruz, Puebla, and Oaxaca.

For MY 2025/2026, production is estimated at 4 million green bean equivalent bags, a 4 percent increase over the previous year. This growth is driven by recovery from heat waves that affected robusta fields in MY 2024/2025. Increased investment in both robusta and arabica management, enhanced pre- and post-harvest practices, and selective harvesting to secure higher quality and market premiums have also contributed.

Domestic consumption trends

Coffee consumption is forecast at 3.2 million green bean equivalent bags for MY 2026/2027, an increase of 1 percent from the previous year. This slight growth is attributed to expansion in retail coffee shops and chains, as well as changing consumption habits favoring premium coffee.

Convenience stores are increasing the availability of ready-to-drink coffee. Caffeine, a coffee company in northern Mexico, has entered a partnership with OXXO, the largest convenience store chain in Mexico. Caffeine produces, roasts, and supplies coffee for nearly all OXXO stores in Mexico and Colombia, ensuring high quality and fast coffee service across the chain network.

Mexico is also Starbucks’ largest market in Latin America and the Caribbean, and its seventh largest globally. With an expansion of approximately 70 new stores annually, the company plans to reach 1,000 stores in the country during 2026.

Major urban areas in Mexico are showing higher demand for high-quality, single-origin coffee. This has created new markets for premium coffee products such as capsules, cold brew, and specialty offerings. Microlots are growing in popularity to meet demand for unique sensory profiles and limited editions.

Online platforms in Mexico are increasing access to specialty coffee brands, single-origin beans, and subscription programs. This online channel enables small roasters to reach customers throughout the country, allowing customers to discover artisanal and responsibly sourced coffee products.

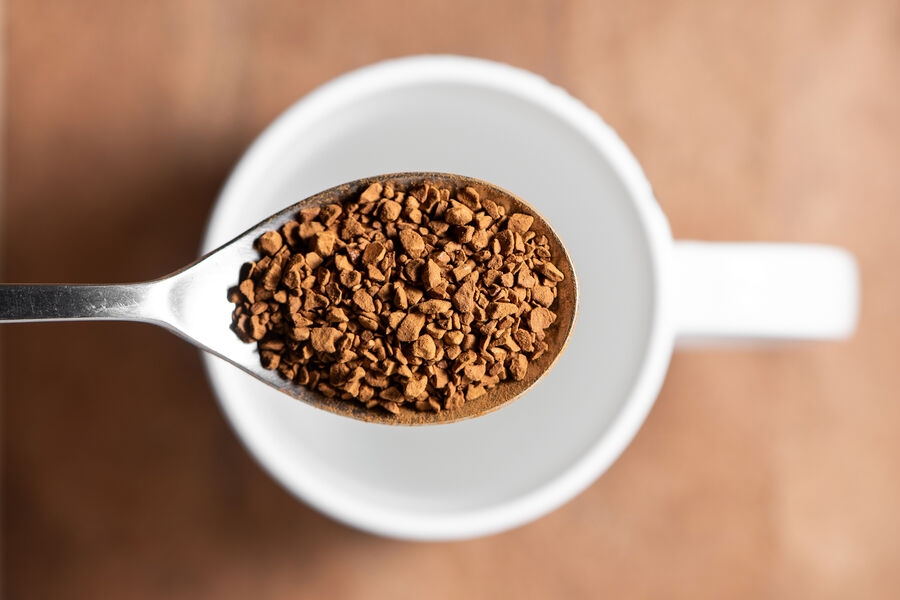
Despite growth in the premium sector, soluble coffee remains more practical and economical, covering approximately 60 percent of domestic consumption. Coffee tricycles, common in Mexico City and other cities, offer café de olla (roasted coffee prepared with cinnamon and sweetened), soluble coffee, and hot chocolate as an affordable and traditional alternative to coffee shops.

Export and import trends

Coffee exports for MY 2026/2027 are forecast at 3.4 million green bean equivalent bags, a decrease of 1 percent from the previous year. Gains in production are expected to satisfy domestic consumption, slightly reducing export volumes.

The United States remains the primary destination market for Mexican coffee in all forms. Exports to the United States reached 2.6 million green bean equivalent bags in 2025. Mexico primarily exports green bean and soluble coffee to the US market.

Coffee imports are forecast at 2.4 million green bean equivalent bags for MY 2026/2027, a decrease of 4 percent. This trend is driven by a forecasted rise in local robusta production, reducing the need for imported green beans. In 2025, the private sector announced various investment programs aimed at increasing coffee production capacity. As a result, Mexico is substituting soluble coffee imports with domestically manufactured products.

Government support programs

Mexico’s Secretariat of Agriculture and Rural Development operates several coffee-specific producer support programs. Production for Wellbeing provides direct financial support of 388 US dollars per producer per year. In 2026, a total of 181,364 producers participated, covering an area of 216,306 hectares.

Fertilizers for Wellbeing delivered 53,542 tons of fertilizer to 151,253 producers in 2026, benefiting an area of 165,984 hectares. This initiative seeks to enhance soil fertility and boost productivity among coffee growers and is expected to expand in scope for 2026.

Café Bienestar, managed by the Secretariat of Wellbeing, aims to distribute affordable coffee through the country network of Bienestar stores. The program buys coffee from producers in Chiapas, Oaxaca, Puebla, Veracruz, and Guerrero and processes it. This program is estimated to represent 3 to 4 percent of the total soluble coffee market.

Frequently Asked Questions

How much coffee will Mexico produce in 2026/2027?
The USDA forecasts Mexico coffee production at 4.1 million green bean equivalent bags for MY 2026/2027, a 1 percent increase from the previous year.

Which states produce the most coffee in Mexico?
Chiapas, Veracruz, and Puebla are the three main coffee-producing states, together accounting for more than 80 percent of national production. Chiapas remains the top producer by volume.

What is the breakdown between arabica and robusta in Mexico?
Mexican coffee production consists of 85 percent arabica and 15 percent robusta. Robusta production is expanding due to its disease resistance and demand from soluble coffee processors.

How is coffee leaf rust affecting Mexican production?
Following years of widespread coffee leaf rust outbreaks, producers have gradually transitioned to replanting arabica rust-resistant varieties. These plants are in early growth stages and are expected to create a more resilient sector.

What is the coffee consumption trend in Mexico?
Domestic consumption is forecast at 3.2 million bags, a 1 percent increase. Soluble coffee covers approximately 60 percent of consumption, while premium and specialty coffee segments are growing rapidly.

Who is the primary buyer of Mexican coffee?
The United States remains the primary destination market for Mexican coffee exports, receiving 2.6 million green bean equivalent bags in 2025.


Author: Qahwa World – Dubai
Source: USDA Foreign Agricultural Service – Mexico City Office
Report Number: MX2026-0026
Date: May 14, 2026

USDA Report: India’s Coffee Sector Faces Climate Challenges and Historic Trade Opportunities

Executive Summary

  • India MY 2026/27 coffee production forecast at 6.14 million 60-kg bags
  • Arabica yields expected to decline 8% due to excessive rainfall followed by extended dry spell
  • Farmgate prices for Arabica down 16%, Robusta down 11% since October 2025
  • New free trade agreements with UK and EFTA countries offer zero tariffs on Indian coffee exports
  • Domestic consumption projected at 1.58 million bags, driven by soluble coffee demand
  • India aims to reach 900,000 metric tons production by 2047

1. Overview: India’s Position in Global Coffee Market

India ranks as the world’s seventh-largest coffee producer, after Brazil, Vietnam, Colombia, Indonesia, Ethiopia, and Uganda. Approximately 95 percent of India’s coffee production is exported, with green coffee accounting for about 59 percent of total exports and instant (soluble) coffee making up the remaining 41 percent.

According to the USDA Foreign Agricultural Service report from the New Delhi office, India’s coffee sector is at a critical juncture. The country faces climate-related production challenges while simultaneously gaining unprecedented access to European markets through newly ratified free trade agreements.

Key Insight: India’s coffee production comprises approximately one-third Arabica and two-thirds Robusta, with Robusta accounting for over 75% of total output due to its greater resilience to weather variability.

2. Production Forecast: MY 2026/27

FAS Mumbai forecasts India’s MY 2026/27 coffee production at approximately 368,400 metric tons, or about 6.14 million 60-kilogram bags, comprising 1.56 million 60-kg bags of Arabica (93,600 metric tons) and 4.58 million 60-kg bags of Robusta (274,800 metric tons).

📊 Figure 1: India Production Trend
Source: USDA/FAS (Chart data described below)
Figure 1: India coffee production has grown at a CAGR of 2.05% between MY 2021/22 and MY 2024/25

Production Data Table

Table 1: India Coffee Production Forecast (1000 60-kg bags)
Category MY 2024/25 (Actual) MY 2025/26 (Estimate) MY 2026/27 (Forecast)
Arabica Production 1,762 1,730 1,560
Robusta Production 4,297 4,700 4,580
Total Production 6,059 6,430 6,140

3. Climate Challenges: The Threat to Arabica

The India Meteorological Department’s first long-range outlook for the 2026 southwest monsoon indicates below-normal rainfall at about 92 percent of the long-period average, with a 66 percent probability of below-normal to deficit conditions.

Arabica output is expected to decline due to below-normal monsoon rainfall combined with unusually high temperatures, which may adversely affect flowering and fruit set. In contrast, Robusta production is projected to remain relatively strong, reflecting its greater resilience to weather variability.

Rainfall Data for Coffee Growing Regions

Table 2: Rainfall Statistics for Karnataka and Kerala (January – April 2026)
State/District Winter (Jan-Feb) Departure Pre-Monsoon (Mar-Apr) Departure
Chikmagalur (Karnataka) Large Excess (+244%) Normal (-17%)
Kodagu (Karnataka) Large Excess (+177%) Normal (-7%)
Wayanad (Kerala) Large Excess (+235%) Deficit (-48%)
Travancore (Kerala) Excess (+48%) Deficit (-53%)

The data reveals a stark pattern: excessive winter rainfall (January-February) followed by deficit pre-monsoon rains (March-April). This extreme weather variability – from flooding to drought within weeks – is precisely the type of climate shock that most damages coffee flowering and fruit set, particularly for the more sensitive Arabica variety.

4. Yield Projections

For MY 2026/27, Arabica yields are projected to decline by eight percent year-on-year to 452 kilograms per hectare, while Robusta yields are expected to fall marginally by two percent to 1,239 kilograms per hectare, although still above the three-year average.

Table 3: Coffee Yield Comparison (kg per hectare)
Coffee Type MY 2026/27 Forecast 3-Year Average (2022-2024) Change
Arabica 452 475 -8%
Robusta 1,239 1,156 +7% (above average)
Why Robusta Outperforms: Robusta yields remain about 2.3 times higher than Arabica, reflecting its greater resilience and productivity. Arabica is more sensitive to altitude, pest, and climate variability, requiring more precise growing conditions.

5. Price Dynamics: Decline from Record Highs

Farmgate prices for Arabica and Robusta have declined by 16 percent and 11 percent respectively since October 2025. Despite this change, prices remain at a premium to other origins, though further moderation is expected. The decline in prices is being driven by expectations of higher output in key producing countries and elevated domestic stock levels.

📊 Figure 2: Farmgate Raw Coffee Prices in Karnataka
Exchange rate: Rupees 92.99 per US dollar (as of April 20, 2026)
Source: Coffee Board of India
Figure 2: Indian coffee prices have moderated but still trade at premium to competing origins

6. Export Outlook: Trade Agreements Transform Market Access

Post forecasts that MY 2026/27 coffee exports will rise by three percent to 6.22 million bags (373,140 metric tons), driven by higher exportable surplus and strong demand for soluble coffee exports.

New Free Trade Agreements

Table 4: New Trade Agreements Benefiting Indian Coffee Exports
Agreement Partner Countries Benefit for Coffee Effective Date
India-UK CETA United Kingdom Zero duty on roast, ground, and instant coffee Recently concluded
India-EFTA TEPA Switzerland, Norway, Iceland Zero percent duty on all coffee exports October 1, 2025

The United Kingdom currently accounts for 1.7 percent of India’s coffee exports, while the EFTA countries (Switzerland, Norway, Iceland) offer new zero-tariff access. Europe has emerged as a more stable trading partner with increased inquiries. Italy remains the top destination, using almost 60 percent of imported Indian coffee domestically while 40 percent is processed for private label manufacturers for re-exports.

Export Destinations

📊 Figure 3: Coffee Export Share by Country (percentage)
Italy leads, followed by Germany, Russia, Belgium, and UAE
Source: Trade Data Monitor, LLC
Figure 3: Indian coffee exported to more than 125 countries, with 61% of shipments from Mangalore port

7. Export Challenges: Premium Prices and Freight Costs

Despite positive momentum, several challenges exist. Indian coffee prices are significantly higher than competing origins from Vietnam and Indonesia. High premiums could pose challenges to exports despite recent prices being lower than last year.

Freight costs to the Middle East have surged dramatically, from $700-$1,200 per 20-foot container in January/February to $1,500-$2,800, with occasional short-term spikes higher due to war risk surcharges, insurance costs, and vessel rerouting. Trade data indicates that about 11-12 percent of India’s total coffee exports in green bean equivalent go to the Middle East, the second-largest regional market after Europe (44-45 percent).

8. Domestic Consumption: A Growing Market

Post forecasts MY 2026/27 domestic consumption at 1.58 million 60-kilogram bags (94,800 metric tons), supported by rising demand for soluble coffee. Household consumption of soluble coffee is expected to account for a significantly larger share of domestic consumption, rising to around 73 percent next year.

India’s per capita coffee consumption remains at 0.04 kilograms, well below the global average of 1.3 kilograms, indicating significant growth potential.

Table 5: Domestic Consumption Breakdown (1000 60-kg bags)
Category MY 2024/25 MY 2025/26 MY 2026/27 Forecast
Roast & Ground Domestic 330 415 420
Soluble Domestic 820 1,160 1,160
Total Domestic Consumption 1,150 1,575 1,580

9. Long-Term Vision: India 2047

The Coffee Board of India has set an ambitious long-term target of increasing national coffee production to 900,000 metric tons by 2047, through a combination of productivity gains, area expansion, and value-chain improvements. This includes replanting old and low-yielding bushes with high-yielding, climate-resilient varieties, promoting better agronomic practices (irrigation, pruning, soil health), and expanding cultivation into non-traditional regions.

📊 Figure 4: Monthly Coffee Exports by Volume (October-September)
5-year average vs 2024/25 vs 2025/26
Source: Trade Data Monitor, LLC
Figure 4: Exports in MY 2025/26 (October-January) were 26% higher than the previous year

10. Imports: Filling the Gap

Post forecasts MY 2026/27 imports at 1.39 million 60-kilogram bags (83,400 metric tons). Imports are expected to be four percent higher than last year as the use of Indian coffee in soluble coffee re-exports remains limited due to domestic beans trading at a premium, necessitating higher reliance on imported beans for processing and value addition.

Green beans account for approximately 94 percent of total imports and are primarily sourced from Indonesia, Kenya, Vietnam, Uganda, and Brazil for processing and re-export.

Table 6: India Import Tariff on Coffee Products
HS Code Product Description Standard Rate
0901.11 Coffee not roasted, not decaffeinated 100%
0901.12 Coffee not roasted, decaffeinated 100%
0901.21 Coffee roasted, not decaffeinated 100%
2101.11.20 Instant coffee not flavored 30%

11. Key Challenges Facing Indian Coffee Sector

  • Climate Variability: Excessive rainfall followed by extended dry spells during critical flowering stage
  • Fertilizer Costs: Persistent shortages and rising input costs across the value chain
  • Labor Availability: Coffee production is labor intensive, with nearly 70% of production cost attributable to labor
  • Premium Pricing: Indian coffee prices significantly higher than competing origins from Vietnam and Indonesia
  • Freight Disruptions: Surging shipping costs to Middle East due to geopolitical tensions

12. Opportunities

  • Free Trade Agreements: Zero tariff access to UK, Switzerland, Norway, and Iceland
  • Growing Domestic Market: India’s coffee market projected to grow at 8.9% CAGR by 2028
  • Soluble Coffee Demand: Double-digit growth in domestic soluble coffee consumption
  • Specialty Coffee: Estate branded coffees commanding prices comparable to export levels
  • Youth Demographic: Expanding urban coffee culture and younger consumers driving growth

Frequently Asked Questions

How much coffee will India produce in 2026/27?

According to the USDA FAS report, India is forecast to produce 6.14 million 60-kilogram bags (approximately 368,400 metric tons) in MY 2026/27, comprising 1.56 million bags of Arabica and 4.58 million bags of Robusta.

Why is Arabica production expected to decline?

Arabica yields are projected to decline 8% due to excessive rainfall in January and February 2026 followed by an extended dry spell during the critical flowering and fruiting stage. Arabica is more temperature-sensitive and has higher water requirements compared to Robusta.

What are the new trade agreements benefiting Indian coffee?

The India-UK Comprehensive Economic and Trade Agreement (CETA) offers duty-free access for roast, ground, and instant coffee to the United Kingdom. The India-EFTA Trade and Economic Partnership Agreement (TEPA), effective October 1, 2025, provides zero percent duty on all coffee exports to Switzerland, Norway, and Iceland.

How have coffee prices changed in India?

Farmgate prices for Arabica have declined by 16 percent and Robusta by 11 percent since October 2025. Despite this decline, Indian coffee prices remain at a premium to other origins, though further moderation is expected.

What is India’s long-term coffee production target?

The Coffee Board of India has set an ambitious target of increasing national coffee production to 900,000 metric tons by 2047 through productivity gains, area expansion, replanting with high-yielding varieties, and value-chain improvements.

Who are the main buyers of Indian coffee?

Italy remains the major buyer, followed by Germany, Russia, Belgium, and the United Arab Emirates. Indian coffee is now exported to more than 125 countries, with approximately 61 percent of shipments originating from the Mangalore port in Karnataka.


US Imports of Soluble Coffee from Russia More Than Tripled in Q1 202

By Ali Al Zakary – Moscow & Dubai | May 9, 2026 | 4 min read

Imports from Russia reached $641,900 in first quarter, while chicory purchases fell 15%

📋 Executive Summary – Key Data from US Statistics Service

  • 🇺🇸 Soluble coffee imports from Russia (Q1 2026): $641,900 (3.5x higher than Q1 2025)
  • 📉 Soluble coffee imports (March 2026 only): $191,400 (25% drop from February 2026)
  • 🇺🇸 Roasted chicory imports from Russia (Q1 2026): $13,800 (15% decrease year-over-year)
  • 📈 Roasted chicory imports (March 2026 only): $3,400 (41% increase month-over-month, 20% increase year-over-year)

1. Soluble Coffee Imports from Russia Surge

The United States, in the first quarter of 2026, more than tripled its imports of soluble coffee from the Russian Federation, according to a RIA Novosti report citing data from the US statistical service (Bureau of Labor Statistics).

Detailed breakdown:

  • During the first three months of 2026, the US imported soluble coffee from Russia worth $641,900.
  • This is 3.5 times higher than the same period in 2025 (Q1 2025).
  • However, in March 2026 alone, shipment volumes fell by nearly a quarter — to $191,400.

2. Chicory Imports from Russia Decline

At the same time, the United States reduced its purchases of roasted chicory from Russia — an alternative to coffee — during the first quarter of 2026.

Detailed breakdown:

  • For Q1 2026, chicory imports from Russia totaled $13,800.
  • This represents a 15% decrease compared to Q1 2025.
  • However, in March 2026, chicory purchases saw a 41% increase compared to February 2026, and a 20% increase compared to March 2025 — reaching $3,400.

3. Largest Suppliers to the US Market

Soluble Coffee:

The largest suppliers of soluble coffee to the United States were:

  • 🇲🇽 Mexico
  • 🇨🇴 Colombia
  • 🇧🇷 Brazil

Chicory:

The largest suppliers of chicory to the United States were:

  • 🇫🇷 France
  • 🇮🇳 India
  • 🇵🇱 Poland

4. Summary Table: US Imports from Russia, Q1 2026

Product Q1 2025 (estimated) Q1 2026 YoY Change March 2026 MoM Change
Soluble Coffee ~$183,400 $641,900 ▲ 250% $191,400 ▼ 25%
Roasted Chicory ~$16,200 $13,800 ▼ 15% $3,400 ▲ 41%

❓ Frequently Asked Questions (FAQ)

Q: Where does this data come from?
A: The data was obtained by the RIA Novosti news agency from the US statistical service (Bureau of Labor Statistics) for the first quarter of 2026.

Q: How significant is the growth in soluble coffee imports from Russia?
A: Imports grew 3.5 times year-over-year — from approximately $183,400 in Q1 2025 to $642,000 in Q1 2026.

Q: What happened to chicory imports?
A: Quarterly chicory imports decreased by 15% compared to last year, but March saw a 41% month-over-month increase and a 20% year-over-year increase.

Q: Which countries are the largest suppliers of these products to the US?
A: For soluble coffee — Mexico, Colombia, and Brazil. For chicory — France, India, and Poland.

📌 Disclaimer

This information is provided for informational purposes only and does not constitute individual investment advice.


✍️ About the author: Ali Al Zakary – Journalist based in Moscow and Dubai, specializing in foreign trade statistics analysis and economic relations between Russia and the Americas. Has been tracking US Bureau of Labor Statistics data since 2020.

Source: RIA Novosti, citing US statistical service (Bureau of Labor Statistics) data, May 2026.

European Commission Simplifies Deforestation Regulation.. What’s New?

By Ali Al Zakary – Dubai | May 8, 2026 | 9 min read

European Commission Simplifies Deforestation Regulation (EUDR 2023/1115): Soluble Coffee In, Leather Out, US Demands Rejected

📋 Executive Summary – What’s New in the Simplification?

  • Micro & small operators (under 10 employees or €2M turnover): exempt from geolocation coordinates (postal address accepted).
  • Compliance costs reduced by 75% annually.
  • Soluble coffee (HS 2101 11 00) added to the product scope.
  • Leather (HS 4101, 4104, 4107) temporarily excluded (subject to review).
  • US demand rejected: geolocation still mandatory for low-risk countries (non-small operators).
  • 📅 Final deadline unchanged: December 30, 2026.
  • 🇺🇸 US exports at risk: estimated $9 billion annually.

Background and Legal Context

Before diving into the details, it is essential to recall that the European Union Deforestation Regulation (Regulation 2023/1115) was amended in December 2025, following requests from member states and the private sector, after it became clear that the original text was so burdensome as to disrupt supply chains. The amendments mandated the Commission to prepare a “simplification review report” to ensure ease of application before the final deadline, which remains fixed at December 30, 2026. This report is what we discuss today.

The Simplification Package – Four Key Pillars

The Commission did not issue a single report but rather an integrated package of four interconnected elements:

  • Formal Report to the European Parliament and Council: Describes all measures implemented since June 2023 and estimates a reduction in annual compliance costs for companies by 75%.
  • Updated Guidance Document (third edition): Provides practically binding clarifications on the definition of “agricultural use” and the role of certification schemes in risk assessment.
  • Revised Frequently Asked Questions (fifth iteration): Addresses marginal cases such as e-commerce, micro and small primary operators, and alternative geolocation methods.
  • Draft Delegated Act amending the product scope: Proposes the addition of 17 codes, deletion of 3 codes, and replacement of 1 code.

Radical Change in Product Scope – Soluble Coffee In, Leather Out

This was arguably the most anticipated item. The Commission has developed a hybrid methodology to evaluate each product individually, combining quantitative and qualitative assessments.

Soluble coffee (HS 2101 11 00): The report states that its exclusion had created a “fragmented approach” in the coffee sector, whereby an illegal producer could convert beans into soluble coffee to evade scrutiny. This decision now subjects all forms of coffee (beans, roasted, soluble) to the same standards.

Leather (HS 4101, 4104, 4107): This exclusion surprised the global leather industry. The report gives four reasons: differentiation of the leather value chain from meat value chains, asymmetries in trade flows, relatively low economic value of hides compared to meat, and the risk of creating an unbalanced approach because downstream leather goods remain outside the scope. Warning: This exclusion may be reconsidered if evidence of circumvention emerges.

Summary of HS Code Changes

Change Type Number of Codes Examples
✅ Added 17 2101 11 00 (soluble coffee), 0206 21 00 (frozen cattle tongue)
❌ Excluded 3 4101 (raw hides), 4104 (tanned leather), 4107 (finished leather)
🔄 Replaced 1 Retreaded tyres replaced with new rubber treads

New Information System – Grouping Feature and Contingency Plan

  • Simplified declaration form for micro and small operators.
  • Updated APIs for large companies.
  • Detailed contingency plan for system unavailability.
  • Voluntary grouping feature: allows companies to group several due diligence statements into one file.

Operator Categorisation – Three Tiers, Different Obligations

Tier Description Key Obligations
Upstream operators Producers, large exporters Full due diligence, geolocation coordinates, statement per shipment
Micro & small operators Fewer than 10 employees or under €2M turnover One-time simplified declaration, postal address instead of coordinates
Downstream operators & traders Distributors, non-SME retailers Keep partner records, verify only if substantiated concerns exist

Low-Risk Countries – Geolocation Not Waived

This is the provision that caused US frustration. Operators sourcing exclusively from “low-risk” countries benefit from partial simplification under Article 13 of the regulation:

  • ✅ Relieved of risk assessment (Article 10) and risk mitigation (Article 11).
  • Not relieved of providing geolocation coordinates (unless they are micro/small operators).

Implication for the United States: Even if classified as “low risk” (as recognised by the August 2025 US-EU Framework Agreement), non-small US exporters must still provide geolocation coordinates. Washington has protested this as “burdensome and disproportionate.”

Global Law Repository and Proportionate Evidence

The Commission committed to establishing a central repository of relevant legislation for each producing country, to be ready by December 2026. The repository will cover land use rights, environmental protection, forest-related rules, indigenous peoples’ rights, labour rights, tax, anti-corruption, trade and customs regulations.

Proportionality principle: High-risk supply chains require in-depth, plot-by-plot evidence collection. Areas posing negligible risk (e.g., US, Western Europe) should not be required to systematically collect comprehensive legal documentation.

US Reaction – $9 Billion in Exports at Risk

Washington points out that 36% of US land area (331 million hectares) is forested, and forest carbon stocks increased by 3.6% since 2010. Despite this, US sources estimate that full application of the regulation could negatively affect US agricultural and forestry exports worth up to nine billion dollars annually, including beef, coffee (all forms), cocoa, soybeans, wood, rubber, and derived products.

The August 2025 US-EU Framework Agreement recognised that US production poses negligible risk to global deforestation. However, the May 4, 2026 simplification package contained no response to the core US demand: exempting low-risk countries from geolocation requirements.

Conclusion

In the final analysis, the European simplification package brought:

  • Good news for micro and small operators (75% cost reduction, postal address option).
  • Bad news for the global leather industry (temporary exclusion, subject to review).
  • Surprise for soluble coffee sector (full inclusion after having been previously excluded).
  • 🚫 No news for exporters from low-risk countries (geolocation mandate remains).

The file remains open for further negotiations before the December 30, 2026 deadline. Will Washington accept this “European disregard” or resort to countermeasures? Only the coming days will tell.

❓ Frequently Asked Questions (FAQ)

Q: Has the deforestation regulation been completely cancelled?
A: No. It has been simplified to reduce burdens on small companies. The final deadline remains December 30, 2026.

Q: How do small companies benefit?
A: Companies with fewer than 10 employees or annual turnover below €2 million submit a one-time simplified declaration and may use a postal address instead of geolocation coordinates.

Q: Is soluble coffee now covered by the regulation?
A: Yes. HS code 2101 11 00 (soluble coffee) has been added to close a loophole that allowed circumvention.

Q: Why was leather excluded?
A: Due to the differentiation of the leather value chain from meat, asymmetrical trade flows, low economic value of hides relative to meat, and risk of imbalance. However, the exclusion is subject to review if circumvention evidence emerges.

Q: Did the simplification satisfy US demands?
A: No. The core US demand — exempting low-risk countries from geolocation requirements — was rejected. US exporters (non-small) still must provide coordinates.

Q: What is the final compliance deadline?
A: December 30, 2026. The simplification changed procedures, not the deadline.


✍️ About the author: Ali Al Zakary – Journalist based in Dubai, specialised in European Union affairs and international environmental legislation. He has been covering the EU Deforestation Regulation (EUDR) since 2023 and has published over 30 reports and analyses on its developments and impact on Arab and global markets.

Sources: European Commission package documents (May 4, 2026), August 2025 US-EU Framework Agreement, US Department of Agriculture forest data (2025).

European Commission Expands EUDR Scope to Include Soluble Coffee

Dubai – Qahwa World

The European Commission has unveiled a new package of measures aimed at simplifying the implementation of the EU Deforestation Regulation (EUDR), while also expanding the regulation to include soluble coffee.

The announcement brings greater clarity to a regulation that has faced repeated delays since it was first proposed in 2021. The EUDR officially entered into force in 2023 and was initially scheduled to apply by the end of 2024. However, concerns from industries and producing countries over preparedness and compliance requirements led to multiple postponements.

The Commission now says it is focused on ensuring the regulation becomes fully operational by 30 December 2026.

As part of the latest revisions, EU officials estimate the simplification measures could lower annual compliance and administrative costs for affected companies by approximately 75 per cent compared with the original framework.

For the coffee sector, one of the most significant developments is the decision to add soluble coffee to the regulation’s scope. Industry representatives believe the move will create more consistent rules across coffee categories and strengthen fair competition within the European market.

Eileen Gordon-Laity, Secretary General of the European Coffee Federation, said the inclusion of soluble coffee would support equal treatment across the sector while reinforcing the environmental objectives of the regulation. She noted that aligned requirements are important for companies preparing for compliance ahead of the implementation deadline.

The updated package also includes changes to the EUDR digital system, with simplified paperwork requirements for smaller producers such as farmers and foresters.

Meanwhile, companies placing products on the market for the first time, including coffee roasters and major importers, will continue to face full due diligence obligations. Businesses further down the supply chain will mainly be responsible for collecting supplier reference numbers rather than independently verifying compliance.

The Commission also proposed removing leather and retreaded tyres from the regulation’s scope. Certain packaging materials, waste products, and product samples would also receive exemptions. In addition, several palm oil derivatives are expected to be added alongside soluble coffee.

Environmental groups have called on the European Union to avoid further delays in implementing the law. Anke Schulmeister-Oldenhove from WWF’s European Policy Office said the regulation must now move from discussion to action, warning that continued postponements could weaken both enforcement efforts and environmental credibility.

The draft Delegated Act is open for public feedback until 1 June 2026.


Roasted and Soluble Coffee Exports Decline in July 2025

Dubai, September 6, 2025 (Qahwa World) – The International Coffee Organization’s (ICO) August 2025 report has revealed a significant decline in exports of both roasted and soluble coffee in July, underscoring new challenges facing the global coffee sector as it navigates volatile prices, shifting demand, and rising production costs. The data highlights not only pressure on green coffee but also on finished products that reach consumers directly, raising concerns about structural changes in the industry.

According to the report, roasted coffee exports fell by a dramatic 63%, reaching only 30,000 bags compared to 81,000 bags in July 2024. This steep contraction marks one of the sharpest drops in recent years for a category that reflects direct consumer demand for value-added coffee products. Soluble coffee exports also registered a decline, albeit more modest, down 5% to 1.08 million bags from 1.13 million bags a year earlier. While less severe, the slowdown in soluble exports is significant because this category has long been considered one of the most resilient and widely consumed segments in global markets, particularly in emerging economies.

Analysts attribute the decline in roasted coffee exports to several interlinked factors. The most immediate is the surge in global coffee prices, with the ICO Composite Indicator Price (I-CIP) climbing by 14.6% in August to 297.05 US cents per pound, its highest level since 2024. Such historic price levels have curbed demand for high-cost roasted products, especially in advanced markets such as Europe and North America, where consumers are already grappling with inflation and higher living expenses. At the same time, exporters face mounting challenges from rising production and shipping costs. Energy, labor, and logistics expenses have all increased in recent months, eroding margins and forcing some companies to scale back international shipments in favor of local markets where conditions are more stable.

For soluble coffee, the 5% drop highlights a different dynamic. Traditionally, this segment has thrived in developing and price-sensitive markets due to its affordability and convenience. Yet even here, demand appears to be shifting. In mature markets, growth has slowed as consumers gravitate toward specialty coffee and fresh roasted options, reflecting a broader trend toward quality and experience rather than convenience alone. In competitive producing countries such as Vietnam and India, rising production capacity has intensified rivalry, putting pressure on exporters to maintain prices and market share. Younger generations in many countries are also seeking more diverse coffee experiences, leading to gradual erosion in the dominance of instant coffee.

The decline in both roasted and soluble exports has broader economic implications. It signals that pressure in the coffee sector is not limited to green coffee or raw supply but extends throughout the value chain. Combined with the ICO’s data showing global coffee stocks at their lowest level since April 2024, the contraction in finished product exports adds another layer of vulnerability to a market already characterized by price volatility and supply uncertainty. Experts warn that if these trends persist, the industry could face an extended period of turbulence, with higher prices for consumers and tighter margins for producers.

Still, opportunities remain in certain regions. Demand for soluble coffee continues to expand in parts of Africa and Asia, albeit at a slower pace, offering some relief for exporters. However, regulatory challenges such as the upcoming EU Deforestation Regulation (EUDR), set to take effect at the end of 2025, are expected to add new hurdles for suppliers attempting to maintain access to key European markets. For roasted coffee, niche segments such as specialty blends and locally branded products may offer pathways to sustain growth, but producers will need to adapt quickly to changing consumer preferences.

The ICO emphasized that roasted and soluble coffee exports should be monitored closely as indicators of global consumption trends. If the declines seen in July extend over the coming months, it could mark the beginning of a deeper shift in how coffee is traded and consumed worldwide. In that scenario, volume alone would no longer be the main metric of success; value-added innovation, consumer engagement, and adaptability to regulatory and market changes would become critical to survival. For now, the combined 63% plunge in roasted coffee exports and the 5% drop in soluble shipments serve as a stark reminder that the challenges facing the coffee sector go beyond farms and warehouses and reach all the way to the consumer’s cup.